

Crude Rises, Oil Shares Drop. A Norwegian Trick

A couple of months ago I had analyzed the bullish pattern that was developing on Crude Oil, when the WTI had exceeded the 200 days moving average and was about to test the crucial resistance of the trendline that joins the 2014 top with the decreasing highs of the first half of this year.
The technical scenario is still positive since the inverse head-and-shoulders that we had analyzed in September is still in place: a significant reversal pattern which shoulders are the lows of 2015 and 2016 and the head is the historical low of last year. The so-called neckline, the resistance above which we the bullish signal is given, has been exceeded at the end of October, above 53$. There is still potential towards the historical down-trending line in the 80s area, even if the recent rally that has reached a maximum at 57$ has formed a top at short term with a consequent pull-back to 55 that has generated new buying interest afterwards.
Something strange occurred however on the Oil related stocks. Their course is usually correlated to that of WTI, and this is quite understandable, but the similar bullish stance that was foreseeable at the end of last summer for the indexes tracking the performance of this sector, has been denied so far. What happened? The Norwegian central bank, which runs the country’s sovereign wealth fund, is intentioned to drop its investments in oil and gas companies, in a move that looks more political than strategical. Norges Bank, which manages Norway’s one trillion fund, intends to protect the country against a permanent drop in energy prices in view of a progressive disengagement of this energy source. The proposal must be approved by the government, nevertheless the reaction for the related stocks has been bad.
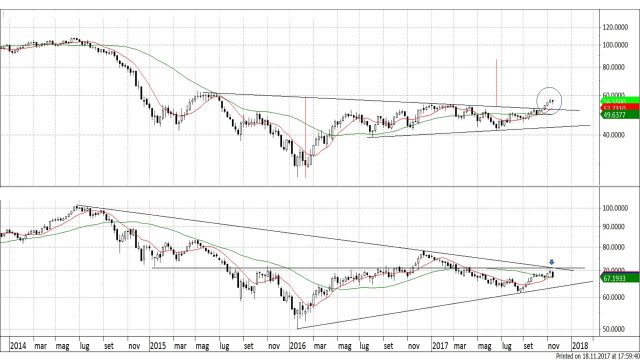
Figure 1 : Crude Oil (on top) and Etf Energy Sector XLE (on bottom), weekly data from 2014 to November 17th 2017.
The chart in Figure 1 compares the weekly data since 2014 of Crude Oil to those of the XLE, the ETF quoted in the U.S. that tracks the performance of the Energy Select Sector Index that has failed to break the major resistance of the down-trending line. In Figure 2 is shown the correlation at three months between the two values: the gradual decrease of the correlation index from 0.70 to 0.30 in a
few weeks, between September and November, is the effect of this occurrence. What to expect? The sell-off has been sharp and since it does not influence at the moment the profit of the oil companies, a positive reaction is quite likely. Furthermore, a decision by the Norwegian government will take time. Meanwhile, we could well see a late positive move on the sector, nevertheless, volatility is likely to increase: an uncertain future is looming for the fossil fuels industry.
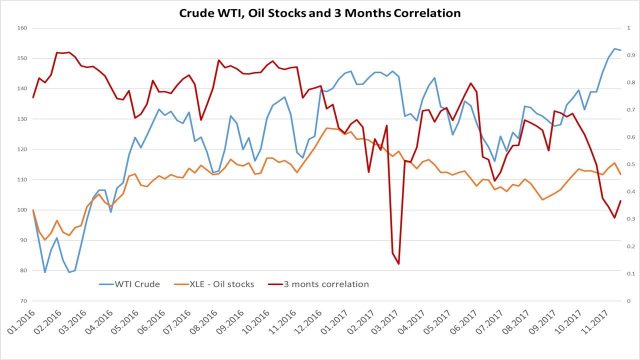
Figure 2 : Crude Oil (blue), Etf Energy Sector XLE (yellow), weekly data 2017 through November 17th. In red, correlation at three months.
Alberto VIVANTI – SAMT Vice President – Graubünden and Liechtenstein Chapter– alberto.vivanti@samt-org.ch
Disclaimer: the above article is for general information and educational purposes only. It is not intended to be investment advice. Seek a duly licensed professional for investment advice.