

S&P 500: a matter of levels

In this last period the stock markets are in a corrective phase. One of the analyses that are made in these situations, is that relating to the search for a correct support level. Even the strategists of the investment banks ask themselves the same question, which is linked, as we read on zerohedge website, with two critical numbers: the Trump put, and the Powell put – these represent the maximum dropdown in stocks that the two most powerful people in the world will allow the S&P to drop before intervening to preserve the “wealth effect”, their reputation, confidence in the economy, etc.

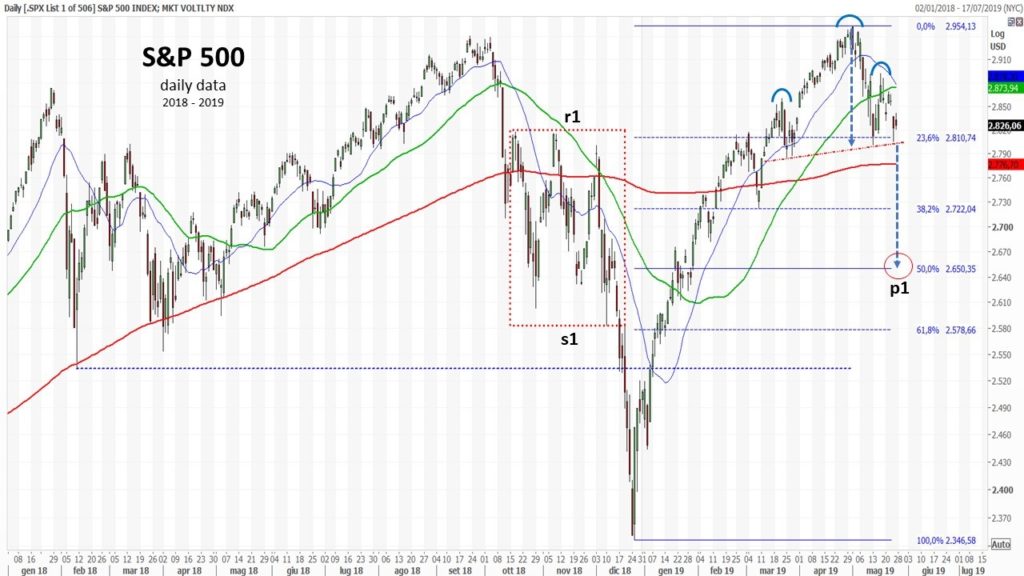
Let’s look now at the most important levels to watch with the use of Technical Analysis. If we consider the daily chart of S&P 500, after the May top at 2.954,13 we could note that we have a lower high that forms a potential head and shoulders pattern. The first projected target for that pattern is at a level that corresponds to the 50% Fibonacci retracement (p1).
Now the price is around 2.800 usd (23,6% Fibonacci retracement), that is a level that was in the last 2018 quarter a strong resistance where price arrived three times (r1). From this point of view also the 61,8% retracement is an area where in the last 2018 quarter we had a good support for prices (s1). In this context, then, all levels of Fibonacci that I mentioned have good reliability in next period.
Another help can be provided by the monthly S&P 500 graph together with the Bollinger bands, useful indicator to understand where the price could lead in terms of volatility. I quoted this method in an article that I wrote in late 2018, suggesting that prices could arrive to touch the lower Bollinger band that could then be considered an area where we could have a short term important low for the period; as you can see in the updated chart, the prices have then reached the expected area (L0). Currently you can see that the lower Bollinger band is around the level of 2,520 (L3): this may be the most extreme level to consider in the next period.
But if you notice carefully, you can identify two very important monthly levels where most closings, openings, maximums or minimums occur. These are the levels around 2,800 (L1) and 2,700 (L2): it is reasonable to carefully watch the next monthly closures and evaluate the behaviour of the index until it constructively exceeds the aforementioned levels. Further long-term confirmation may also be provided by the MACD, which currently indicates a bearish situation (a)

Mario Valentino GUFFANTI CFTe – SAMT Vice President – Swiss Italian Chapter – mario.guffanti@samt-org.ch
Disclaimer: the above article is for general information and educational purposes only. It is not intended to be investment advice.