

STOXX Europe 600 Utilities: a sector to watch
Last year the European stock market was one of the least performing: the Stoxx 600 Index closed with a loss of more than -13%. The only STOXX 600 Super Sector survived with a modest loss of -1,7%, was the STOXX Europe 600 Utilities Index.
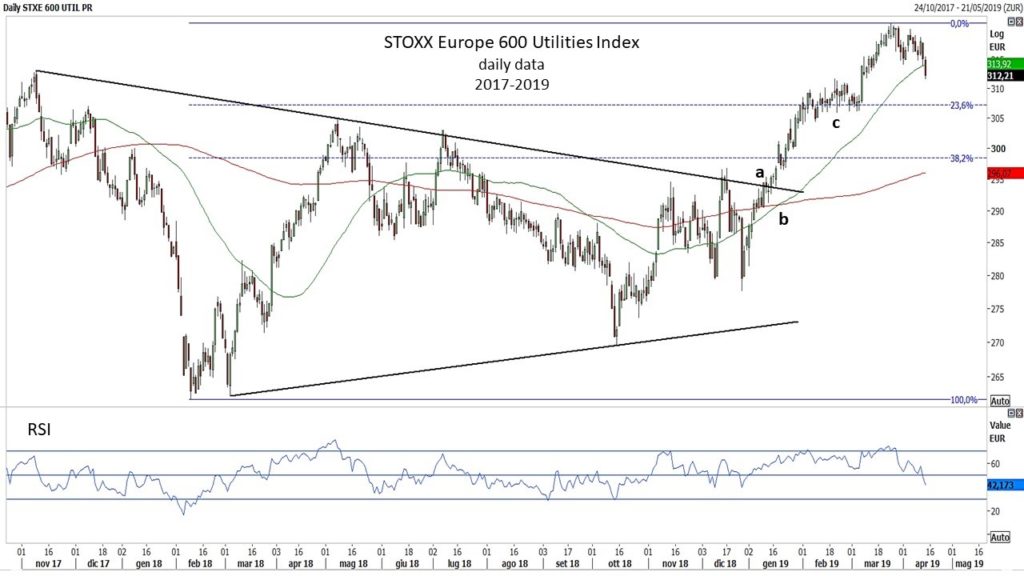
In January I wrote an article pointing out that the price has broken the down trendline of a symmetrical triangle (a), and the 50-day moving average up crossed the 200-day moving average (b), confirming the price trend. At that moment it was the only Super Sector with price and 50-day moving average above the 200-day moving average. In February we had a period of consolidation (c), in March a new high, and now the price is pointing down to the 23,6% Fibonacci level, area of February consolidation, and first support level to check. The second support level is in the 38,2% Fibonacci area, that matchs the 200-day moving average.
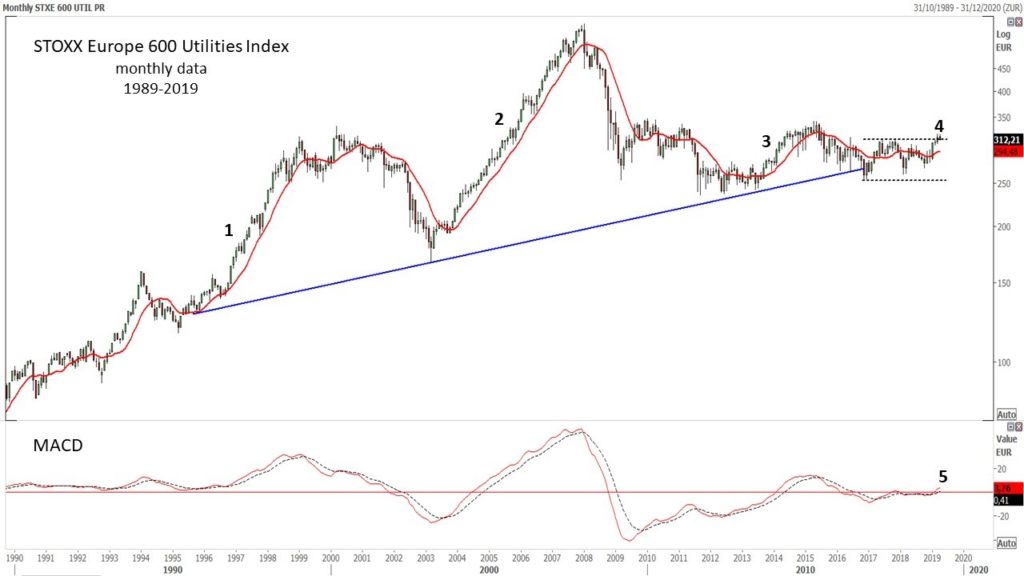
In my January article, I pointed out also that in the long term the Stoxx 600 Utilities sector did not yet reveal data showing adequate strength to develop a good medium-term trend: that because if we looked at prices on a 30 years long term monthly chart, we could note two bullish markets periods in 1989-2000 (1) and in 2003-2007 (2). Then a modest rise between the end of 2013 and the end of 2014 (3), and after that, the movement was quite flat; in the last years the index was contained in a sideways trend channel and the oscillator was flat. But with the March candle close, we could note that the trend channel has been slightly overcome (4), and the Macd up crossed the zero line (5).
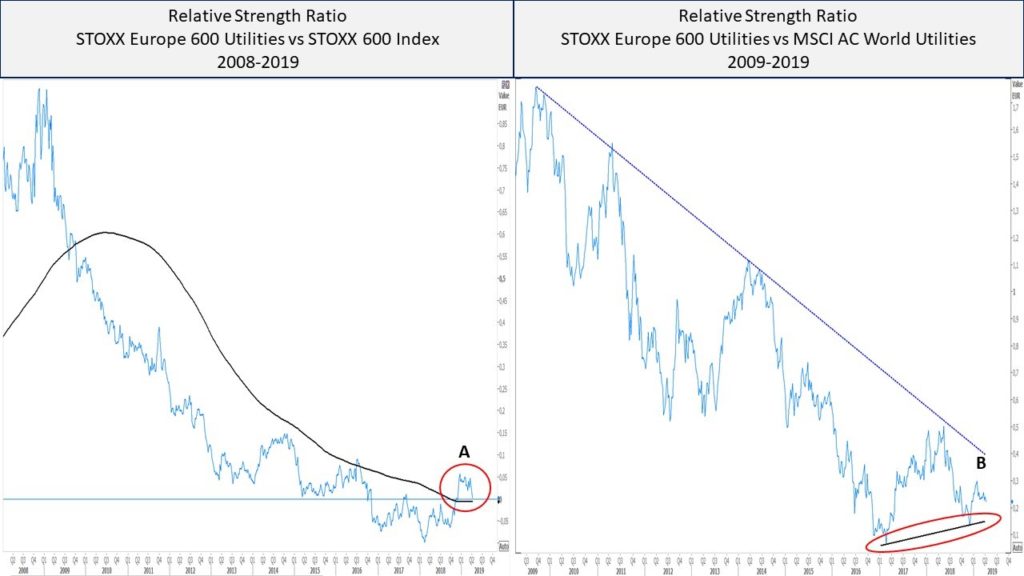
In the next period we must carefully look at the Relative Strength ratios. The RS ratio of the Stoxx 600 Utilities sector compared with the Stoxx 600 Index, at the beginning of December exceeded its 200-day moving average (A) and is now returned on the moving average. The relative strength ratio of the European Super Sector, compared with the MSCI AC World Utilities index, started, always in the same period, a short-term bullish leg with two higher lows and it is moving towards the historical long-term bearish trendline (B).

Mario Valentino GUFFANTI CFTe – SAMT Vice President – Swiss Italian Chapter – mario.guffanti@samt-org.ch
Disclaimer: the above article is for general information and educational purposes only. It is not intended to be investment advice. Seek a duly licensed professional for investment advice.