

The Wall Street Rally Needs a Pause. But when, and how?

After concluding an excellent 2017 and starting the new year on a positive note, Wall Street confirms its strong momentum and the bulls are still controlling the market. Prices move into unexplored territory, there is a plenty of bulls around, the chart pattern of the major indexes reflects a typical sustained trend. As always happens in similar cases, concerns are mounting about the risk of an exhaustion driven market meltdown.
It cannot be denied that the major benchmarks of Wall Street are in the middle of a prolonged overbought situation. A look at the indicators shows, for example, that the distance between the value of the Standard & Poors 500 and its 40 weeks moving average is historically very high: values above 10% for this indicator are usually reached after prolonged rallies but not necessarily anticipate a trend reversal.

Figure 1: S&P500 – weekly data, 2011-2018. At the bottom: the ratio between S&P500 and its 40 weeks moving average is showing the highest reading in five years.
When a positive trend persists, momentum indicators may keep getting stuck to overbought levels for a long while. Reversal signal are not detectable, at least by now, but no one can deny that such an overstretched rise makes the market vulnerable.

Figure 2: S&P500 – daily data since august 2017. The January rise is now parabolic, increasing risk of a sudden pullback.
The constant rise of the last six months reflects a robust uptrend, defined by a constant progression of relatively higher lows and highs. Yet, each extension is sustained by a steeper trendline. This makes even more difficult for the average investor to decide at which price level to jump out. To which extent should a market correction be considered as a trend reversal signal? One could consider the 200 days moving average (40 weeks in a weekly data chart) as a breakdown level between bull and bear trend. In this case we should consider a 12% correction as a normal pullback. If we look at trendlines as trend supports, then it depends to which degree of trend an investor prefers to be anchored. The short term trend, that had started with the November low, finds support at 2730, just a 3% below the current level, but the medium term trendline, originated by the August lows, is now at 2660, giving a 5% room to a likely correction to coming down before a bearish signal materialize. Many investors are just waiting for a price retreat as an opportunity to jump in. Is this a wise attitude? It could, as long as the uptrend is confirmed, but, beware if a so-called failure swing would occur.
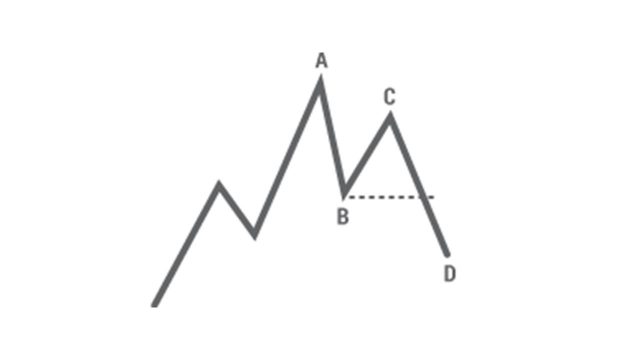
Figure 3: In the Dow-theory this is known as a failure swing. The rebound, after a correction, fails to reach a new high. Then, the last relative low is violated. This is a typical reversal signal.
Alberto VIVANTI MFTA – SAMT Vice President – Graubünden and Liechtenstein Chapter– alberto.vivanti@samt-org.ch
Disclaimer: the above article is for general information and educational purposes only. It is not intended to be investment advice. Seek a duly licensed professional for investment advice.