

S&P 500: what’s next?

In my article dedicated to the S&P 500 of mid-December 2018, I wrote that looking to the monthly S&P 500 graph together with the Bollinger bands, we could have a useful indicator to understand where the price could lead in terms of volatility. The lower Bollinger band coincided with the 50% Fibonacci retracement and that level, around 2.370, could then be considered an area where the price could form a short term important low for the period. The low arrived on December 26th at 2.346,58, very close to the mentioned value: see the point (1) in the third chart of the article.

Looking at a medium-term chart, we can note that in 2018 a very different pattern has been developed in comparison to that of the period between the end of 2014 and the beginning of 2016. In that timeframe, in fact, the prices had formed, after a major correction, a first low in mid-October 2014 (1) and then two new lows in January and February 2016 (2) that retested the previous level low. After that the price was able to build a bullish trend that finally came out of the period of sideways trend.
In 2018, however, prices went well below two lows that had been formed at the end of January and April 2018 (3), removing that potential appearance of a sideways market like the one mentioned above and forming an important new low (4) with a subsequent mini-rally.
The VIX, which is in the lower frame of chart 1, has fallen below the critical level of 20, but is not yet low enough, remaining in a zone that could indicate a new revival of volatility (a).

Looking at a weekly chart with a shorter timeframe we can see that the price is in a rather critical area where we have the short-term down trend line and Fibonacci retracement of 23.6% (2). The oscillator has turned upwards and has now arrived in a level of resistance that will have to pass to demonstrate that prices have regained their strength (a). In the previous January 2018 correction, after the price passed the short-term down trend line, in the following weeks it moved sideways (1).
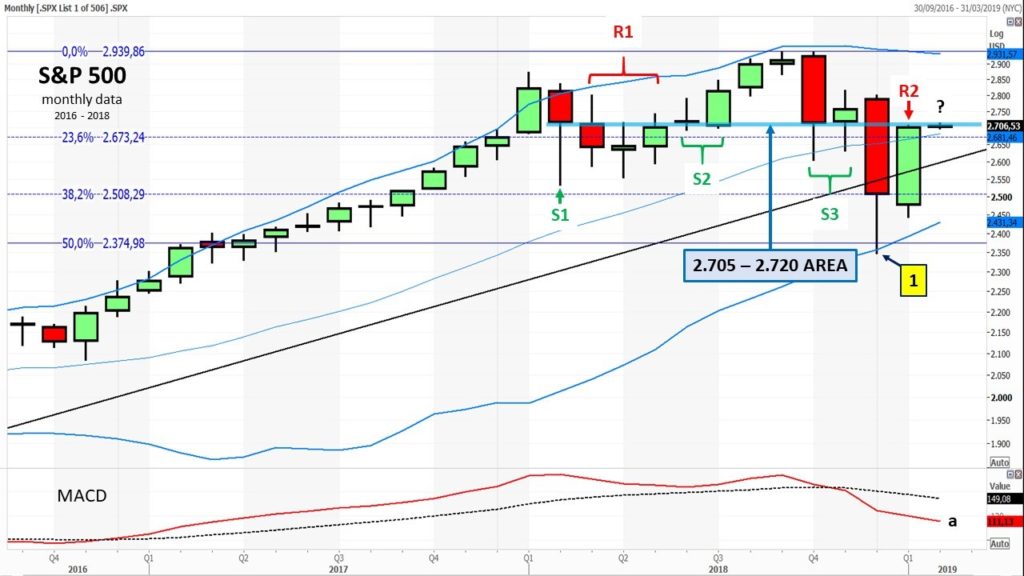
If we move to a monthly chart, we can note that we have a very critical zone in the 2705-2720 area. If you notice, in the last 12 monthly candles, in that area we had 5 monthly closings, 3 monthly openings and a monthly maximum. In February 2018 the level served as a support (S1) and in the following 3 months was
instead resistance (R1). Again, support in June and July (S2), in October and November (S3), and resistance in January 2019 (R2). This Friday, February 1st, the S&P 500 Index opened and closed right in that area. It should also be noted that the long-term oscillator is still pointing south (a)
This brief analysis suggests that now, after the recent and rapid recovery in prices, it would be reasonable to be more cautious and evaluate the behaviour of the index until it constructively exceeds the aforementioned area.

Mario Valentino GUFFANTI CFTe – SAMT Vice President – Swiss Italian Chapter – mario.guffanti@samt-org.ch
Disclaimer: the above article is for general information and educational purposes only. It is not intended to be investment advice. Seek a duly licensed professional for investment advice.