

A Five-Point Reversal on Dow Jones and S&P 500?
The pioneer technical students lumped together many patterns under the classification “Five-Point Reversals”. A hypothesis that I would like to share today is that of a probable formation of one of these patterns, the orthodox broadening formation, potentially developing on two indices: the S&P 500 Index and the Dow Jones Industrial Index. First let’s see what an orthodox broadening formation is.
This kind of pattern is not so very common to find on price graphs; it occurs when a series of three or more price fluctuations widen out of size so that peaks and troughs can be connected with two diverging trendlines. Generally, the pattern comprises three rallies with each succeeding peak higher than its predecessor, and each peak separated by two bottoms, with the second bottom lower than the first one. Orthodox broadening formations are associated with market peaks. Several of these patterns, according to Edwards and Magee, appeared at the 1929 Tops of many of the active and popular stocks of that day. Perhaps we can best see what this formation is, if we examine the image below. I have numbered from 1 to 5 the significant turning points.
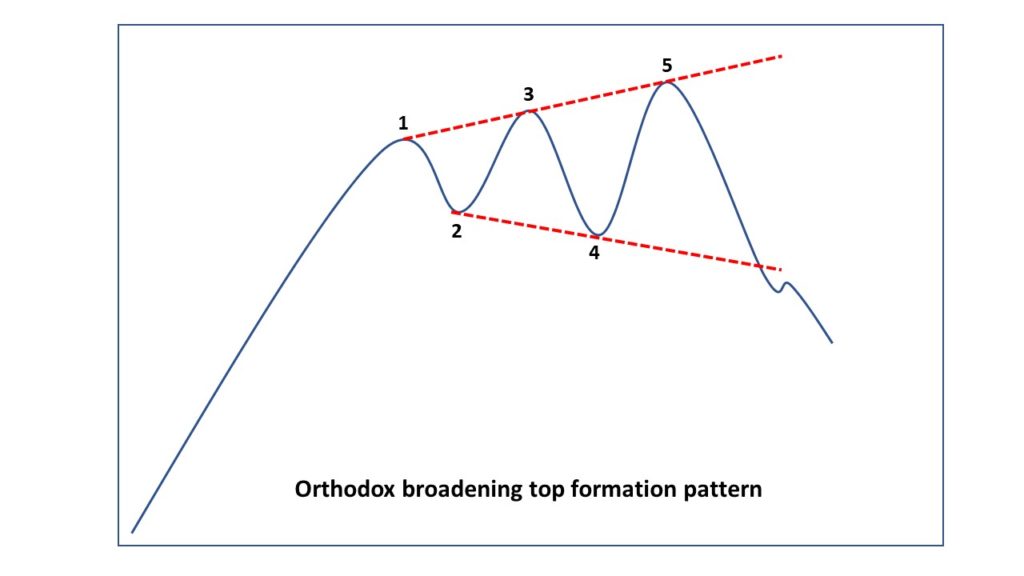
As we can see, the pattern comprises three rallies, with each succeeding peak higher than its predecessor (1, 3 and 5), and each peak separated by two bottoms (2 and 4), with the second bottom lower than first one.

As we can see from the graphs of the two indices side by side (S&P 500 on the right and DJI on the left), in the eventual broadening pattern in formation we need a higher high to form the fifth point. This would indicate that the indices could rise to a higher level than that of the period September-October 2018: I have intentionally omitted any indication between the last candle of the two graphs and point 5, because it is not possible to know now what will be the path that the prices will make to get to that point.
In Technical Analysis the patterns are not predictive but probabilistic. Sometimes a pattern could be negated but also this event could be a valid information. We must always remember that for the technical analyst what matters is not the pattern itself, but the psychological model behind the graph: the model that best describes step by step the psychological behaviour between buyers and sellers, to identify which are the most probable points of junction that could change the balance between them, thus triggering a new trend in the price curve.
The orthodox broadening formation generally indicates a period of violent and emotional nature where the prevalence between sellers and buyers alternates with increasingly broad trends due to the underlying uncertainty of the period. Usually at the end of the pattern the sellers take over. But in some cases, the opposite can happen.
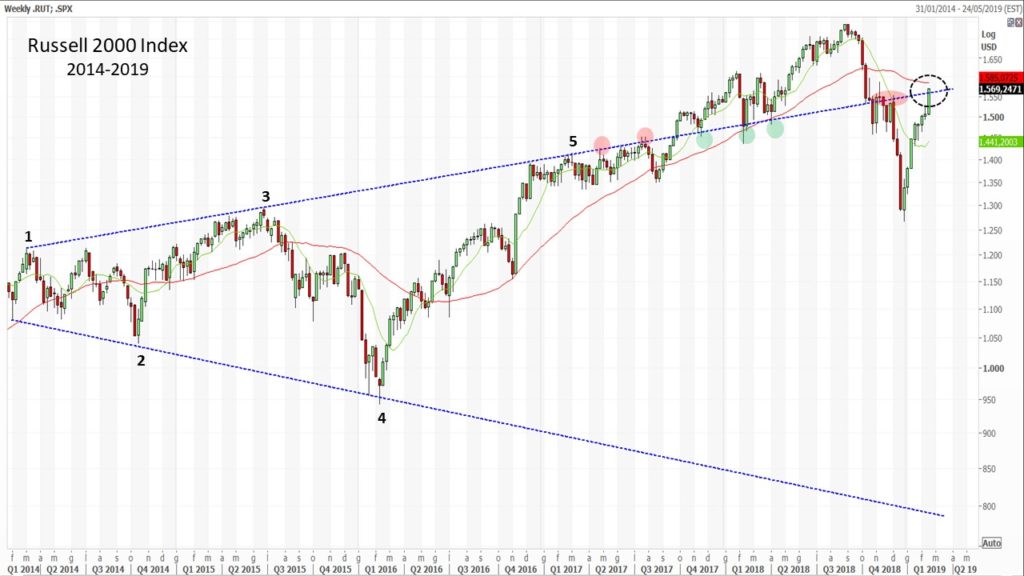
This is to say that in case prices reach the fifth point, it is not certain that there will be a reversal, but that area could still be an important reaction point for the balance between buyers and sellers. A practical example is what happened on the Russel 2000 index in March 2017 (5). In that period, I wrote an article pointing out a possible fifth reversal point of an orthodox broadening formation. As can be seen in the graph, prices continued for the following months to “walk” under the up-trend line, which proved to be a tenacious resistance line. Then prices up crossed the resistance, which later became support several times and then became resistance again in the latter part of 2018. Last Friday the price slightly up-crossed the up-trend line.

Mario Valentino GUFFANTI CFTe – SAMT Vice President – Swiss Italian Chapter – mario.guffanti@samt-org.ch
Disclaimer: the above article is for general information and educational purposes only. It is not intended to be investment advice. Seek a duly licensed professional for investment advice.