

STOXX Europe 600 Utilities: a sector to watch

Last year the European stock market was one of the least performing: the Stoxx 600 Index closed with a loss of more than -13%. The only STOXX 600 Super Sector survived with a modest loss of -1,7%, was the STOXX Europe 600 Utilities Index.
At the beginning of 2019 I wrote some articles suggesting to follow carefully this Supersector. In fact, despite the long-term trend was sideways, the prices and the oscillator were in a potential turning point. But it was also important to check the trend of relative strength.
Let’s start by looking at the daily graph from the end of 2017.
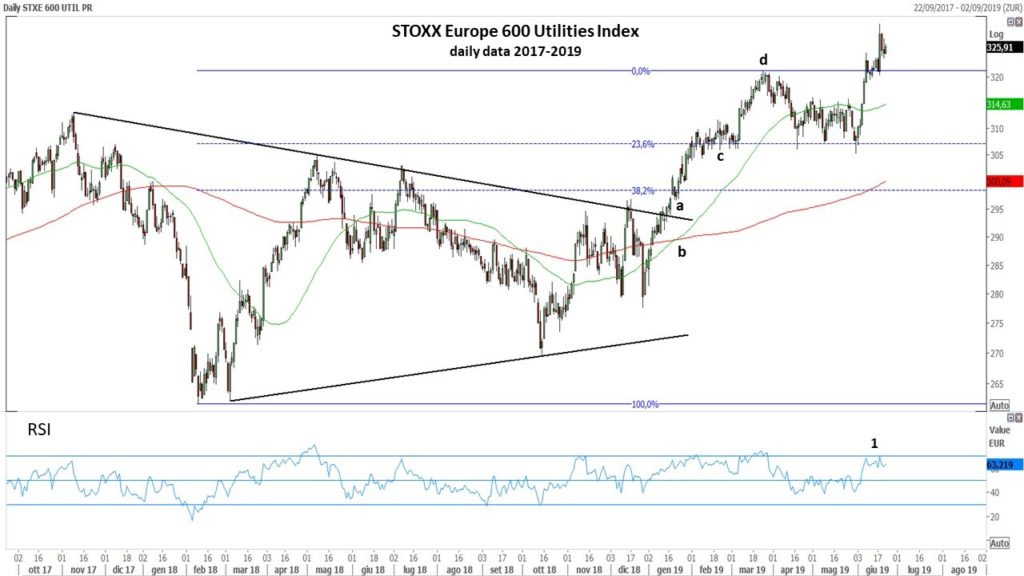
You can see that at the beginning of 2019 the price has broken the down trendline of a symmetrical triangle (a), and the 50-day moving average up crossed the 200-day moving average (b), confirming the price trend. In February we had a period of consolidation (c), and in March a new high (d).
My previous analysis was made in April 2019, just after the maximum formed at the end of March 2019. I wanted to keep the levels of Fibonacci retracements on the March high to highlight that the April-May retracement ended up right at the level of 23.6%. In June we had a new impulse wave that exceeded the previous high, and now is probably in consolidation phase. However, the oscillator did not overcome the level of 70 (1), and therefore this could indicate a certain weakness in prices for the future period.

If we look at prices on a 30 years long term monthly chart, we could note two bullish markets periods in 1989-2000 (1) and in 2003-2007 (2). Then a modest rise between the end of 2013 and the end of 2014 (3), and after that, the movement was quite flat; in the last years the index was contained in a sideways trend channel (4) and the oscillator was flat. But in the last period the oscillator up crossed the zero line (a) and if the candle that closes this month remains at current levels (b), it is already a good first attempt that indicates the possibility that the top of the channel becomes a support for future prices.

The Supersector’s Relative Strength ratios are well tuned. The RS ratio of the Stoxx 600 Utilities sector compared with the Stoxx 600 Index, at the beginning of December exceeded its 200-day moving average but needs to overcome the resistance indicated by the red line (A). The relative strength ratio of the European
Super Sector, compared with the MSCI AC World Utilities index, started, always in the same period, a short-term bullish leg with two higher lows (B), and it is moving towards the historical long-term bearish trendline.

Mario Valentino GUFFANTI CFTe – SAMT Vice President – Swiss Italian Chapter – mario.guffanti@samt-org.ch
Disclaimer: the above article is for general information and educational purposes only. It is not intended to be investment advice. Seek a duly licensed professional for investment advice.