

Euro Stoxx Value stocks or Euro Stoxx Growth stocks: is it time to shift to defensive Value style?

At the end of September of last year, I wrote an article about European Value and Growth Stoxx Indexes.
The definitions of Value and Growth stocks come from Fundamental Analysis rather then Technical Analysis. However, Technical Analysis can also evaluate these types of stocks using the Relative Strength Ratio. If we historically compare the Euro Stoxx Total Market Growth Large Index with the Euro Stoxx Total Market Value Large Index creating a chart of the last twenty-one years, we obtain the following graph.
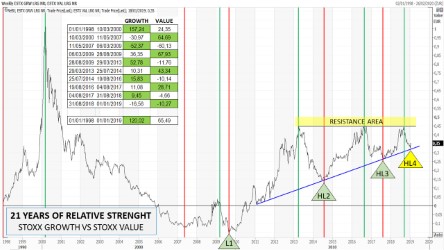
Every time the ratio rises, Growth stocks perform better than Value stocks. Each period has been separated with a vertical line coloured in red if the period is favourable to the Growth style or in green if the Value style predominates. Within the graph, you can see a performance table indicating the results for each period considered.
It is clear that in the long run the Growth style is numerically more performing (120,02% vs. 65,49%).
Towards the end of 2009, the Growth style took over the Value style, creating a historical low (L1), and two subsequent higher lows (HL2 and HL3), and probably a new higher low in these last weeks (HL4). But in this bullish construction there were no higher highs, but only a triple top that was formed between 2013 and 2018.
On a chart with a narrower time horizon, we can see that the indicator is forming a triangle pattern. It is interesting to note that an oscillator like the MACD can identify very clearly the negative divergences (indicated in the black dotted channels), which anticipate a potential weakness and fall of one style with respect to the other.

In October 2018, I pointed out the potential formation of a new negative divergence that could be supportive for a future greater strength in favour of the Value style (point 1 of the chart). In the following weeks the Value Index overperformed the Growth Index for a 6,29% (Value Index -10,27% and Growth Index -16,56%). Now the ratio has touched for the third time the support of the pattern (a), and its MACD is turning up (b). But the path to the resistance area is much shorter. It is reasonable to follow this new event to see in the coming weeks what will happen between Growth Style and Value Style.

Mario Valentino GUFFANTI CFTe – SAMT Vice President – Swiss Italian Chapter – mario.guffanti@samt-org.ch
Disclaimer: the above article is for general information and educational purposes only. It is not intended to be investment advice. Seek a duly licensed professional for investment advice.