

Europe Basic Resources Supersector: it is time to watch the index closely

The STOXX 600 Basic Resources Supersector Index has touched for the fourth time in 26 years its historical uptrend line.
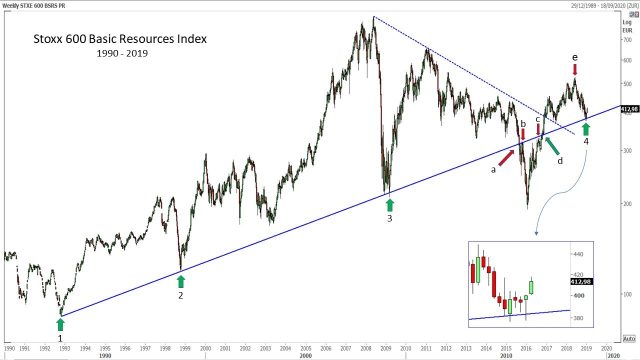
As you can easily see, the index began a secular long-term uptrend from October of 1992 with a trend line that was regularly touched in October 1992 (1), October 1998 (2) and in December 2008 (3); in August 2015, the price broke the support line (a) and a pullback followed (b). In August 2016 the index tried to attack, without success, the trendline that historically was its support and that turned into a resistance (c): at the end of October 2016 we had a new attempt that was resolved with an up cross of the historical trendline (d); a good uptrend developed in the following years. In June 2018 the Index topped (e), generating a retracement wave that touched for the fourth time the historical uptrend line (4), beginning a short-term uptrend.
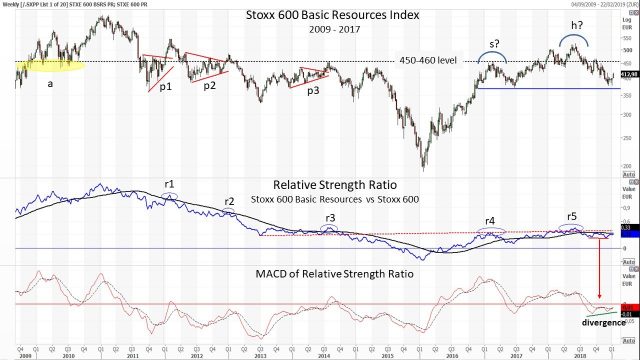
If we look to a medium-term chart, we could verify where the index could meet the first resistance levels. As we can see, the 450/460 price range, has always been in the past a support and resistance level. In all 2010 has been a good support level (see the yellow area “a” in the graph), in the following years the range played more the role of resistance level. Prices have always moved around it creating triangles patterns in three occasions (upper graph, p1, p2 and p3). But the upward breakout of these patterns never worked very well. Among other things, in this last period a potential head and shoulders pattern (bearish pattern) is forming its right shoulder that could have its top exactly on the 450 level.
A more comprehensive explanation can be given using the Relative Strength ratio. As we can see, all the triangle pattern (upper frame of the graph, p1, p2 and p3) are accompanied by false breakouts that create a short-term peak where the Relative Strength Ratio forms a top and then down cross its 200-day moving average (center frame of the graph r1, r2 and r3). We have the same behaviour in r4 and r5, were it has formed the potential tops of the left shoulder and head of the head and shoulder pattern. But as we can see in the bottom frame of the chart, in the last weeks the relative strength ratio Index formed a negative divergence with its MACD, after a consolidation started since January 2016. So, if we consider this movement with the price index pointing north in the short term, the 450-price level could be very important.
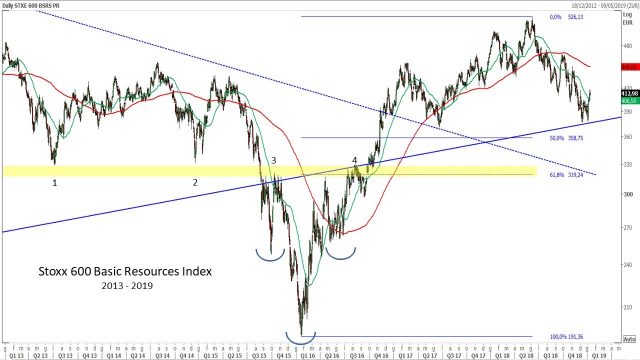
If the price breaks the historical uptrend line, which is very close to the 50% Fibonacci level, an important support lies at 61,8% Fibonacci retracement. In that area (yellow in the graph), we had two important supports (1 and 2), and two important resistances (3 and 4): it is time to watch the index closely.

Mario Valentino GUFFANTI CFTe – SAMT Vice President – Lugano Chapter – mario.guffanti@samt-org.ch
Disclaimer: the above article is for general information and educational purposes only. It is not intended to be investment advice. Seek a duly licensed professional for investment advice.