

Gold: cup & wedge

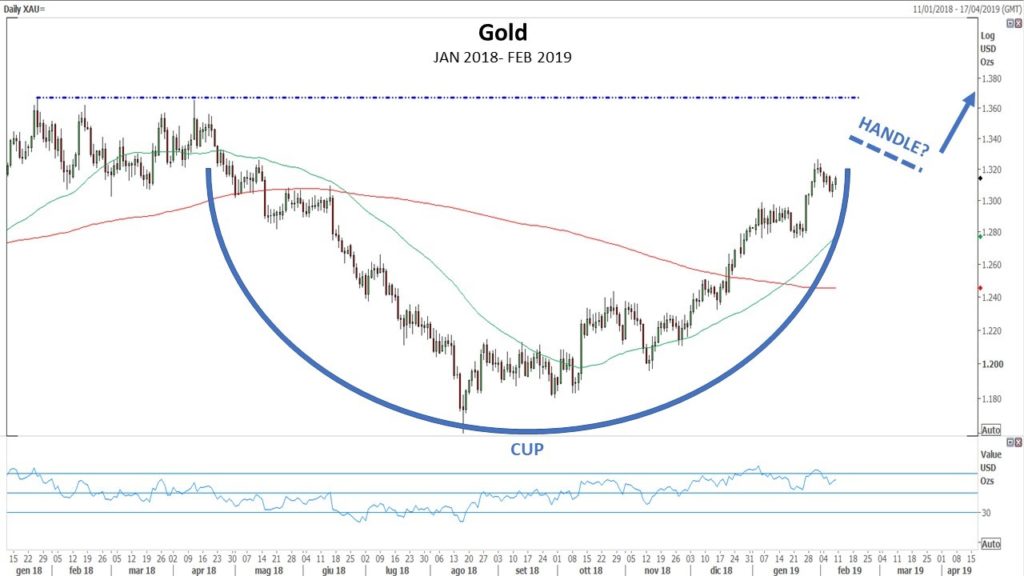
This February, I wrote an article on gold pointing out the possibility of a formation of a Cup-with-a-Handle pattern. This price pattern looks like a cup with a right handle. The bottom part of a cup pattern should be rounded and give the appearance of a “U” rather than a very narrow “V”. The forming of the handle is usually more than one or two weeks in duration, and it is the classical period of profit taking in which both volume and price go quiet. Finally, the handle is completed, and prices explode to the upside. Generally, a price drop in a proper handle should be contained within 10% to 15% (this pattern is described in William O’Neil’s book “How to Make Money in Stocks” – McGraw-Hill – 1995). In the following graph, we could note how the pattern appeared in February.
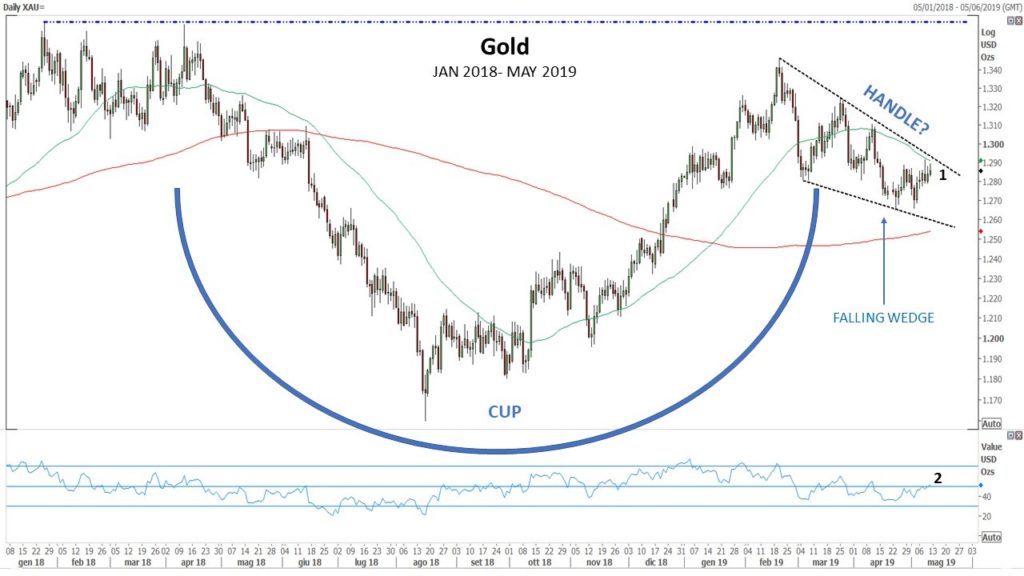
By its very nature, the cup with a handle is a consolidation formation that could confirm the up trend that started at the beginning of 2016. If we look the next updated chart, we could note that prices are forming the potential handle, where we could find a falling wedge, that is a pattern that represents a temporary interruption of a rising trend. Prices are reaching the 50-day moving average area (1) and the RSI oscillator has just up crossed the 50-level line (2), indicating that price keeps a good strength.
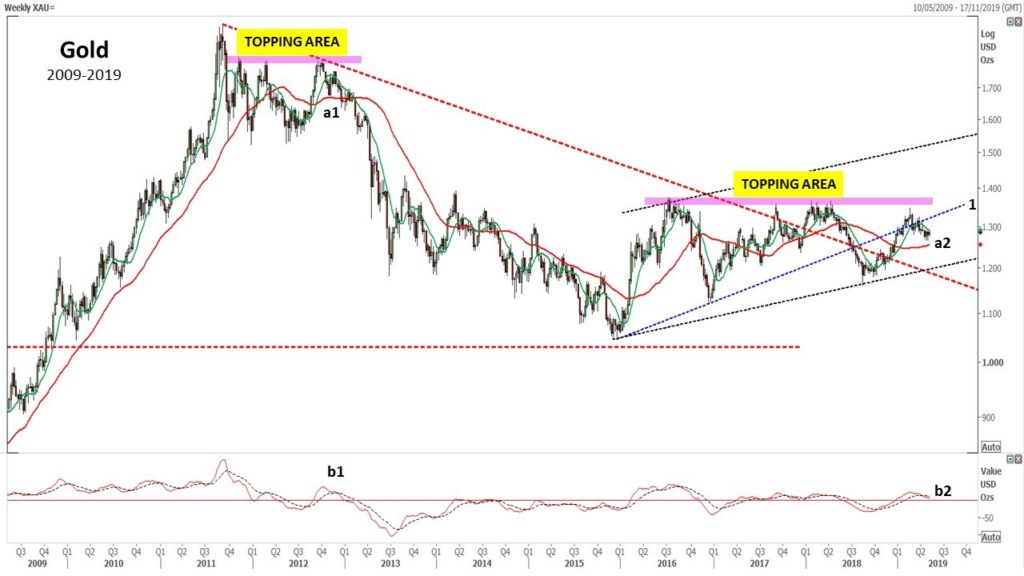
But if you look to weekly medium term chart, some caution must be considered: it is true that in the last weeks the 50-day moving average up crossed the 200-day moving average (a2) and the Macd up crossed the zero line; but now is turning down (b2), and the same happened in 2012 (see a1 and b1), when the price didn’t have enough strength to overcome the level of resistance of the topping area, forming a lower high of a bear market. The 2012 pattern couldn’t not be considered a Cup pattern, because we hadn’t a rising trend in the months preceding its formation, but we need, at least, that prices could be supported in the 1200/1230 area, base of the up-trend black dot channel.
If the falling wedge pattern will work, another good indication will be that the price could return above the short-term blue up trendline (point 1 in the graph below).

Mario Valentino GUFFANTI CFTe – SAMT Vice President – Swiss Italian Chapter – mario.guffanti@samt-org.ch
Disclaimer: the above article is for general information and educational purposes only. It is not intended to be investment advice. Seek a duly licensed professional for investment advice.