

Offensive against the forex market

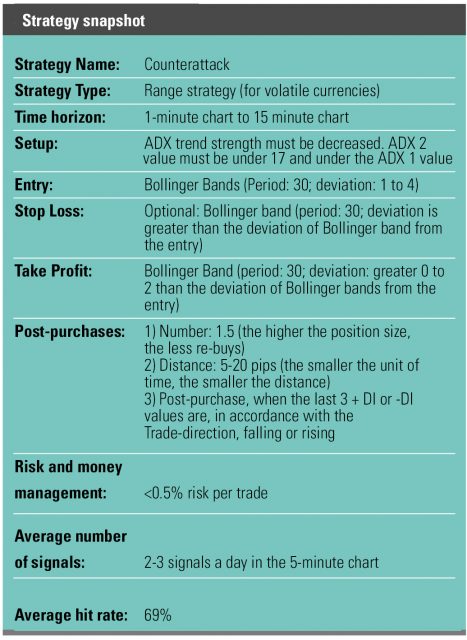
The Counter-Attack Strategy
The counter of any movement of the market sounds like a lot of work. The profitable mastering of these movements is almost utopian. In this article is a strategy presented that attempts to realize this idea, without exposing your account to a big risk. First we will dismantle this strategy into its components and then look at some sample trades. The Counter-Attack Strategy is a Range-Strategy and that means that we do not want to run with the trend, but try to close our trades as soon as possible with a profit. This trade idea works best in smaller units of time – in our examples is the 5-minute chart used. We need the following four indicators:
- Average Directional Index (ADX) as range filter for entry
- Bollinger Bands * for the profit target (take profit)
- Bollinger bands for entry
- ADX as a filter for the later purchase

Range filter
Since our Strategy wants to ‘’counter’’ the movements, we must position ourselves against a movement and thus need trendless market phases. As filter for the entry are two Average Directional Index (shortly: ADX; see box) used. The first ADX should have a number of periods of less than 20, the second ADX value should have a period number over 25 and under 35. The level is between 15 and 20. In the lower part of Figure 1, the ADX 1 has the period 18 and is light blue. The ADX 2, on the other hand, is dark blue and has the period 29. The + DI value and -DI value are ignored. Instead, it is focused on the main lines, so the trend strength. All long-lasting movements in one direction result in losses. An ADX 2-value below a determined level and at the same time is under the ADX 1-value indicates a trend loose phase. This means that the price does not move in one direction, but varies in a certain price range. The “certain level” can vary between 15 and 20 and is different for each trading instrument. The appropriate level is found out using Paper-Trading by simulating the strategy with different limits on the respective trading instrument. In Figure 1, the threshold level is set to 17. It can be seen that the price runs sideways when the ADX 2-value is below the level of 17 and below the ADX 1-value (point 2). Market phases with higher and / or rising ADX-phases indicate long-lasting movements and are therefore ignored (point 1 and 3). The Range filter gives green light if the following two criteria are met:
- ADX 1 is greater than ADX 2
- ADX 2 is less than 17
Entry
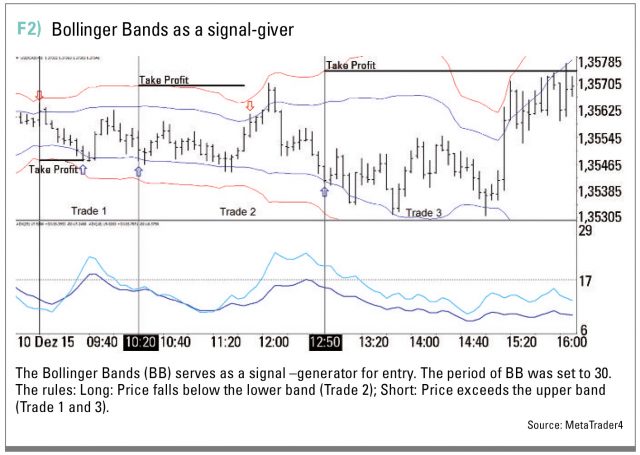
To get started, let’s take a look at the Bollinger Bands (BB). The period of BB was set to 30. This indicator forms with the two lines, our sideways phase. For entry the following rules apply:
- Long: Price falls below the lower band (trade 2 in Figure 2)
- Short: Price exceeds the upper band (Trade 1 and 3 in Figure 2)
We buy when we are in lower area of a sideways trend and sell when we are in the upper range. So we assume that the price will exert a sinusoidal motion when the price is in a trend-less phase. The “deviation” parameter is responsible for the size of the range, which is formed by the BB indicator. The higher the deviation, the less trades will be executed since the two bands since the two bands are rarely reached by the price, and vice versa. In our case the deviation is 2.4.
Exit
The trades are done without stop-loss because the frequency of trades in the 5-minute chart is very high, so that trades are either picked up by reaching the Take Profits or closed by a subsequent counter-signal.

Take Profit
A Take Profit in the form of a fixed pip-indication would be inefficient, because the span of the range from trade to trade is different and depends on the Bollinger band for the entry (called BB_EN). So we need a Take Profit, which adapts to the span of the current sideways-phase – again Bollinger Bands (BB_TP). The BB_TP has the same period as BB_EN, but a different deviation. It is recommended to set the BB_TP deviation slightly larger than the BB_EN deviation. In this way, the gain of an average trade is increased. Trade 1 and 3 in Figure 2 were closed by Take Profit.
Countersignal
A counter-signal is generated when the criteria of the filter are met and the course tends above or below the Bollinger Bands. Signal-generation occurs sometimes more often than you would like, so that no big moves against the direction of our positions (long or short) can occur. The second Trade in Figure 2 has been closed by a counter- signal.

Post-purchase
The post-purchase is carried out according to strict rules. For this purpose, a fixed distance is used, which has been set in the strategy evaluations on five pips. The post-purchase has among the traders a bad reputation, because it increases the risk. The risk is, however, increased only by blind post-purchases. However, the Counter-Attack Strategy applies a filter, so that the post-purchased positions may be open only under certain conditions. This results in a post-purchase-system with less risk. It should be noted that the average probability of success of a trade is around 69 percent (see Figure 3 “sell-positions (won)” and “Buy-positions (won)”). The probability of winning of a position that was bought later at a lower price is even higher. ADX is used as a filter for the post-purchase. The period in this example was set to 50. In this indicator, not the trend strength, but the + DI and -DI line comes to the fore. Additional positions are opened when the ADX filter satisfies the following conditions.


Long-post-purchases
- + DI: Three current values are ascending
- -DI: Three current values are falling
Short-post-purchases
- + DI: Three current values are falling
- -DI: Three current values are ascending
This condition ensures that positions are opened only when the price is developed in favor our first position. The risk and the drawdown are thereby strongly reduced. The performance of the strategy remains even without the post-purchase-system in the green zone. The ratio between the profit and the drawdown is in the Counter-Attack Strategy without the post-purchase-system a little less – this means that the subsequent purchasing is long term profitable.
Evaluation of the strategy
In Figure 3, you can see a report on the performance of our strategy in 2015. A particularly important figure is represented by the following relationship: Profit/Draw-down: 8718,20 / 2744,46 = 3,18. This means that we risk just one euro for each acquired 3.18 euros. This ratio is greater than 1 and therefore to evaluate as positive. The number of gained trades is around 69 percent, which means that the Counter-Attack Strategy generates mostly profitable signals. Figure 4 shows the capital curve for 2015. The result looks very good when one considers that the strategy had with a fixed position size (0.1 Lot). The profit amounts to 8718.20 euros – so, nearly 87 percent profit for 16.88 percent risk.
Conclusion
Finally, we are interested in whether this strategy works in the long term. Because, it brings us nothing if the strategy is only one year only and burns money in the rest period. In Figure 5 we see the capital curve of the Counter-Attack Strategy from 2001 to 2015. The number of trades (about 33 000) emphasizes the high frequency of trades. It can be seen that the capital has been increased from 10,000 to 50,000 euros with a fixed position size (0.1 Lot). The fact that this strategy is on average profitable since 2001, indicates the universal behavior of the market in smaller units of time (one to 15 minutes) and the profitable exploitation of these behaviors.

Feature article by:
![]()