

Profitable trading with Bollinger-Bands

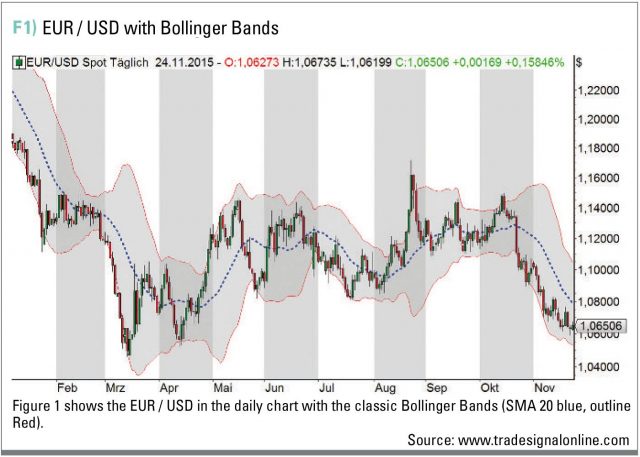
The Bollinger bands belong to the absolute standard tool for many traders. Even the inventor does not recommend the sole use. Christian Stern looks at the relationships and introduces following a specific trading strategy. Bollinger bands, in their known form today, have been developed in 1984 by John Bollinger. The aim of the indicator is, to follow indicative the trends of price movements, to border them, to make them visible and to set them free from “market noise”. Based on the normal distribution, is generally assumed that prices are statistically more likely near the average, rather than far from it. To calculate the Bollinger bands, we first build a simple moving average (also called Simple Moving Average, in short: SMA) of the last 20 periods.
Subsequently, the price course is bordered above and below by two more, from the standard deviation derived bands (see Figure 1).
Bollinger Bands in the trading practice
In practice, Bollinger bands are a good element for the Technical Analysis and a reliable method for visualizing price volatility. The convergence of the outlines towards the SMA, indicates a narrowing of the price movement. This may indicate an upcoming decision of the direction with emerging dynamic, after a breakout movement of the bands. There are as well different trade setups. Since the price runs from band to band, it is easy to determinate the price target, possible even if no other features can be found from the technical analysis. In addition, it’s easy with Bollinger Bands to recognize sideways phases when SMA is running flat. They can also be interpreted as support and resistance lines. Breakouts from the bands, on the basis of closing prices, show a relative strength of the movement and should be interpreted as confirmation of the trend. In dynamic markets, the prices move in an extended period of time along the outlines.
Bollinger bands are a good element for the Technical Analysis and a reliable method for visualizing price volatility
The bandwidth provides a measure of the fluctuation range of the price course. Accordingly, narrowed bands can be an early sign of upcoming strong movements. If the course breaks from the bands by an increase in the fluctuation on the basis of closing prices, then we expect a sustained price movement.
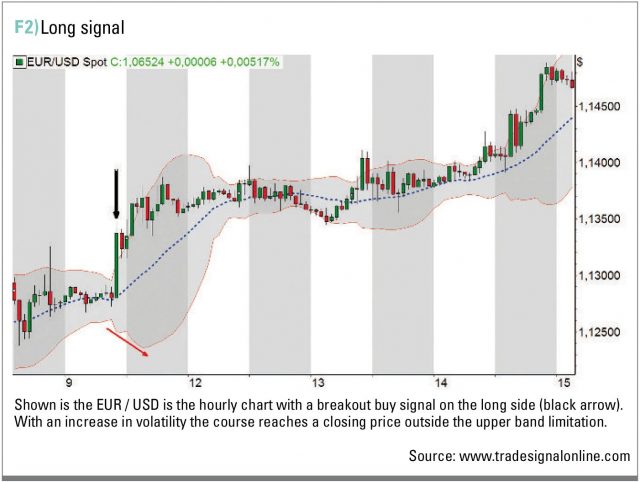
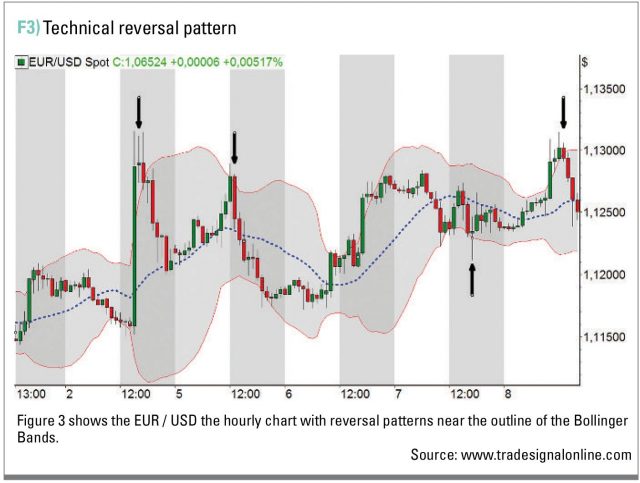
As shown in Figure 2, the middle line may be used as a classic stop-loss. Bollinger Bands alone do not provide a “Holy Grail”, however, are well suited for combination with other methods of analysis and thus to increase the hit rate. For example, if reversal candlesticks in the vicinity of the outlines are formed, then there is an increased probability of a trend turnaround (see Figure3).
Profitable trading with Bollinger Bands
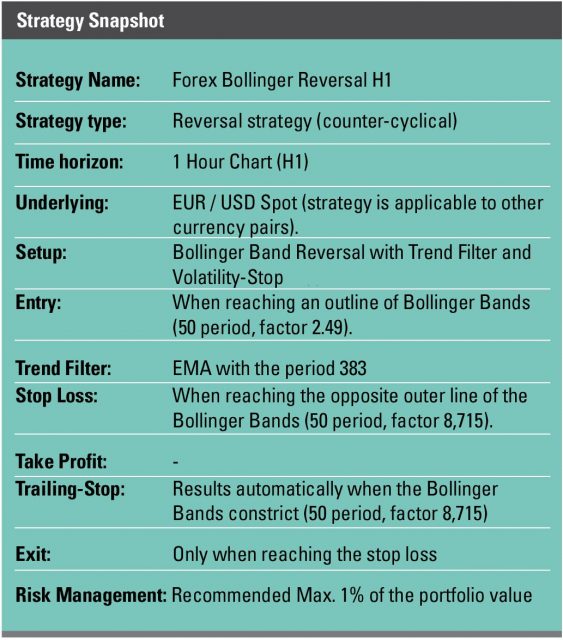
We have the statistics to create a trading system using the Bollinger bands and thus created a profitable approach. However, the implementation requires some combinations and settings far from the classic use of the indicator. Basically we apply the system only on the major currency pair EUR / USD at a Bollinger band with period 50 and a factor of 2.49, in the hourly chart (H1). In the independent broker trading software MetaTrader 4 (MT4) the indicator is named “Bands”. The factor is referred to as “deviation”.

In Figure 4, this Bollinger band is colored in black. If the price touches one of the two outer bands, is an order in the respective direction activated (Short at the bottom, long at the upper border). In addition, a moving average with exponential smoothing (Exponential Moving Average, short: EMA) with the period 383 filters the major (higher) trend correction. If the price is lower, short orders are activated, and only prices above the trend filter allow long positions. Due to this combination, is in Figure 4 only a “sell limit order” (sell) at the upper black band shown, however, no long-order at the bottom – the filter-EMA is the blue line.
Positions-Management
For the determination of a suitable (adequate, appropriate) stop-loss, another Bollinger band is needed with the same period, however, a 3.5-fold factor (8,715), which is statistically advantageous for trading. In Figure 4 we see this indicator shown in red. Above the “Sell Limit Order”, an Exit will take place in case of a loss. Since, the Bollinger Bands are always adjusted on the volatility in the underlying price; the stop loss is also partly flexible. In order not to increase the initial risk of no more than one per cent of total portfolio value, a tightening to hourly closing prices when a constriction of the red Bollinger Band occurs, but not in an expansion. Thus, an active management of the position is achieved, which should be developed in our favor. Exit occurs only by reaching the Stop Loss – a Take Profit is not foreseen in this strategy. Within the system, an order in the EUR / USD is at any time placed or activated. Other position openings or pyramiding with renewed signals do not exist.
Conclusion
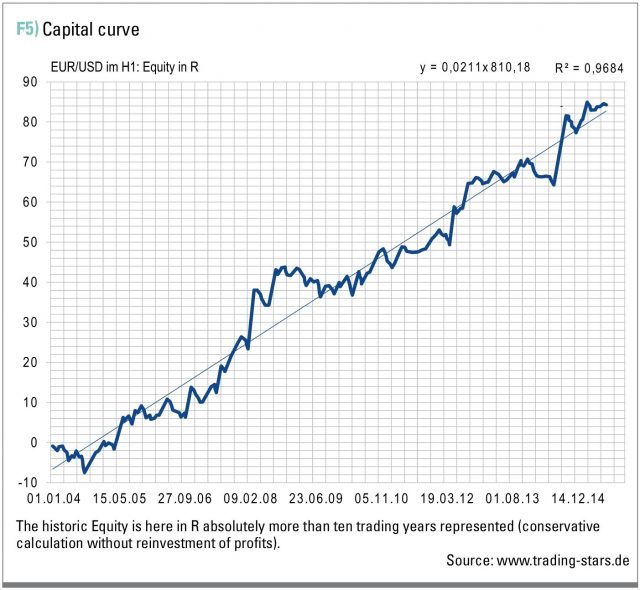
According to the logic of our presented trading system many limited losses are standing opposite (facing) to a few large winning trades. This produced within the past decade, an extremely stable development of the account. The system follows clear rules and is suitable as a standalone trading strategy for active traders. An enormous improvement in the equity is achieved through diversification, also through adding more underlyings. The authors themselves are working with a total of 21 liquid currency pairs.

Christian Stern
As a full-time trader with around twelve years of market experience, Christian Stern is the head of securities trading and of the field of education of Trading Stars. The focus is in the provision of basic and expert knowledge for successful trading. christian@trading-stars.de
 Stefan Friedrichowski
Stefan Friedrichowski develops trading strategies based on scientific principles and has made his passion his profession. He is full time trader since 2013. stefan@trading-stars.de
Feature article by
![]()