

Spread BTP-BUND in a new normal

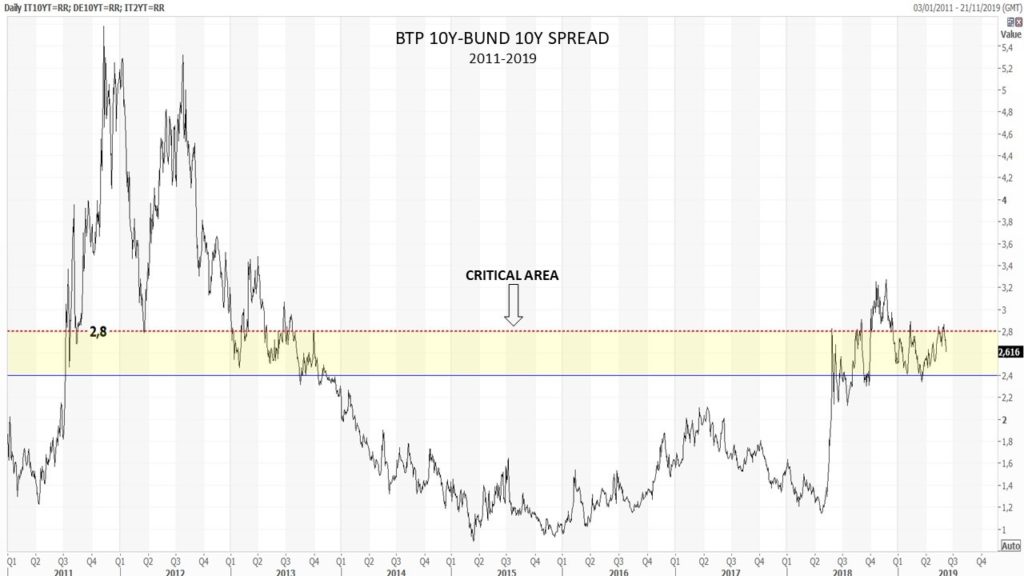
In this last period, the BTP-BUND spread has been reported several times in economic newspapers each time the indicator was around 280. In fact, the 280 level is a historical level of support and resistance, which is the reason why the indicator is often found around that number. As we can see from the long-term chart that also includes the Italian crisis of 2011, the area 240-280, can be considered as a zone of attention from which the indicator, if it suddenly exceeds 280, could go to higher levels very quickly indicating a scenario of strong crisis for the Italian debt.
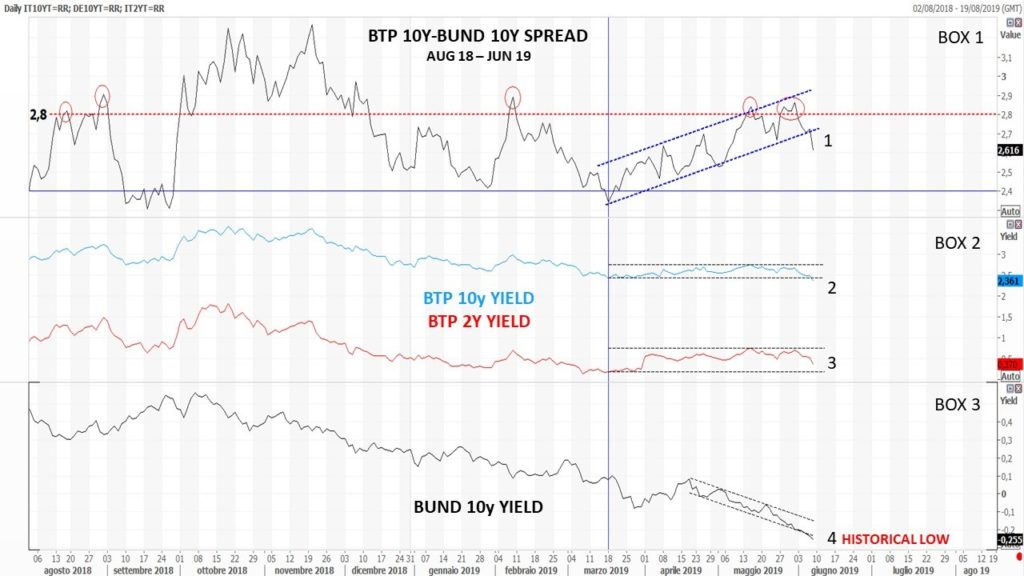
A month ago, I wrote an article about the fact that the BTP-BUND spread was behaving abnormally compared to the past. Since the half of March 2019, the volatility of the pattern had completely changed: while in 2012 and 2018 all indicators moved upwards very quickly and with high volatility (Spikes), this time for the Spread the movement was slower but progressive and contained in a bullish channel (see in the next chart BOX 1 from the vertical blue line).
The reason for this is how the spread indicator is constructed: it is the difference between the yield on Italian 10-year government bonds, the BTP, and the German ones, known as the BUND. Generally, the correlation between the two variables is expected to be constant over time. This means that when there are problems in Italy, the yield on the BTP rises and that on the BUND falls because the market sells Italian BTPs, at that time considered too risky, to position itself on the safe German Bunds. These movements then cause the spread to rise.
This time the two yields that constitute the spread have decorrelated in an anomalous way. If we consider in fact the last increase movement of the spread started on March 18 (blue vertical line in the chart), we will be able to notice that it lacks a strong rise movement of the BTP yield (blue line BOX 2), and therefore the increase movement of the Spread has occurred mainly for the decline of the BUND yield. In the last days the BTP yield has even dropped, breaking down the channel in which it was contained (see BOX 2 point 2), while the BUND yield has continued to decrease reaching last Friday a historical minimum (see BOX 3 point 4). The result of the anomalous movement of the two yields, brought down in the last week the Spread, that has broken the bullish channel where it was contained (see BOX 1 point 1).
It is difficult to indicate the reason for this sudden movement of the yield on the BUND; there are those who speculate that the European situation is more frightening than the Italian one, but probably the change of president of the ECB in October and expectations about a potential interest rate cut by the FED, could be factors that are beginning to influence the positioning of professional investors on European bonds.
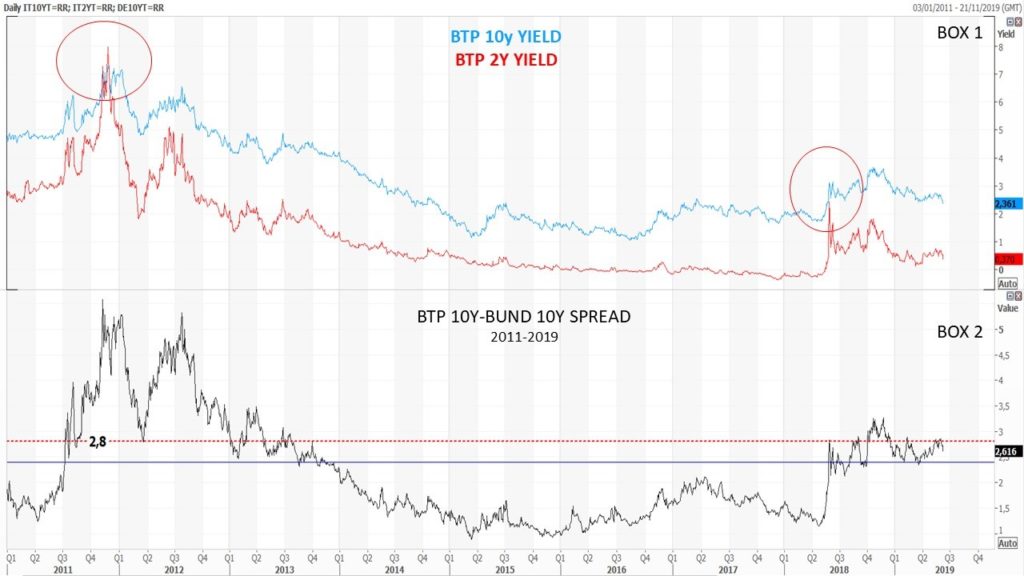
I suggest, therefore, for those who want to have more reliable data to measure the situation of potential crises in Italy, to assess the difference between the 10-year BTP yield and the two-year BTP yield. This difference generally indicates likely stages of recession or pre-default (when short rates become higher than long rates).
In the graph you can see that the red line of the yield of the two-year BTP yield, did not fall to its previous low of March 18 as happened with the 10-year BTP yield (see BOX 2 point 3). This therefore indicates a potential but slight criticality on the Italian debt.
Looking at a chart from 2011, you can see that the 2-year BTP yield, in critical moments tends to approach quickly, or even exceed the yield of the 10-year BTP, as happened in 2011.

Mario Valentino GUFFANTI CFTe – SAMT Vice President – Swiss Italian Chapter – mario.guffanti@samt-org.ch
Disclaimer: the above article is for general information and educational purposes only. It is not intended to be investment advice. Seek a duly licensed professional for investment advice.