

Stoxx 600: price comes back in an important range area

From the beginning of the second quarter of 2017 until the end of second quarter 2018, the Stoxx 600 price topped several times in the 395-400 level area (r3). A big correction followed and now the price is in the previous 335-350 level area (yellow area in the graph).
Looking to the graph we can see that in 2014 (r1) and 2016 (r2) the 350 level has been a very strong resistance where the price topped several times before a nice breakout. At the end of the second quarter of 2015 we can note that the same area has been a good support for the first part of the 2015 correction (s1). Moreover we can note that in this range area we have the strongest presence of the candles of the graph, mainly in 2014 and 2016.
So, some kind of reaction, even if there are no signal of strength on the oscillators, could develop in the next periods.

Looking to the Index since the 2009 bottom, we can note that we have three impulsive waves with three retracements. If we measure the retracements starting from the most important low for every impulsive wave (the 2009 bottom and the two lows that corresponds to the lower measure of the MACD oscillator, m1 and m2), we can note that the first retracement arrived to the 61,8% Fibonacci level, the second between the 50% and 61,8% levels, and in this actual third retracement the price is very near to the 61,8% level: another element that could suggest that the price could begin to consolidate.

However, the current correction is more limited than the two previous corrections (-15,16% vs -28,37% and -27,12%). Nonetheless, it should be noted that in the two previous medium term bull markets, the percentage increase of the price level was much higher than in the last one (+88,03% and +98,40% vs a poor +33,42%).
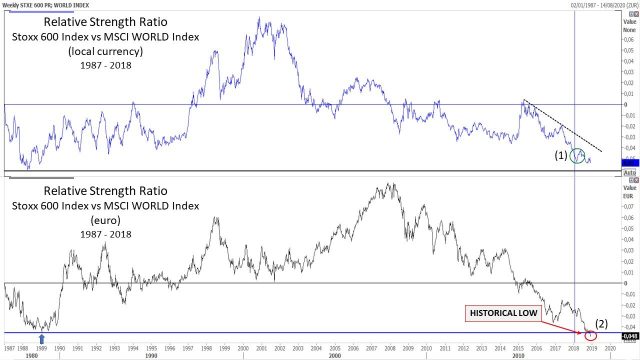
Another element that I have always considered even in my previous published analyses, is the check of the relative strength of the Stoxx 600 Index versus the MSCI World index (upper frame of the graph). At the beginning of 2018 I wrote an article in which I considered that the Stoxx 600 Index was falled at an historical very low value, a kind of oversold zone where some reaction could start. We had a reaction, but very short and weak (1). If we consider the indicator in euro (lower frame of the graph), it is at an all-time low. If the ratio continues to show signs of weakness despite a future rise in the index, it would be better to overweight other stock markets.

Mario Valentino GUFFANTI CFTe – SAMT Vice President – Swiss Italian Chapter – mario.guffanti@samt-org.ch
Disclaimer: the above article is for general information and educational purposes only. It is not intended to be investment advice. Seek a duly licensed professional for investment advice.