

Stoxx 600: some historical and short term considerations

At the end of September (1), I wrote an article about the Stoxx 600 Index, indicating several factors of a potential bullish construction, although the relative strength signals versus the MSCI World Index and a weakness of the dollar did not favour the strength of the short-term trend.
The bullish trend begun at the end of 2016; it easily crossed the down trend line (b) and the resistance level of the previous 2015 high, situated at Fibonacci level of 23,6% (a). We had then a top in May, with a higher high (H1). A retracement followed and stopped at the 38.2% Fibonacci level, forming a higher low (L1). The oscillator also turned upward after touching the zero line (c). After September we had a new short uptrend that crossed again the resistance level of the double top formed by May and November 2017 highs.
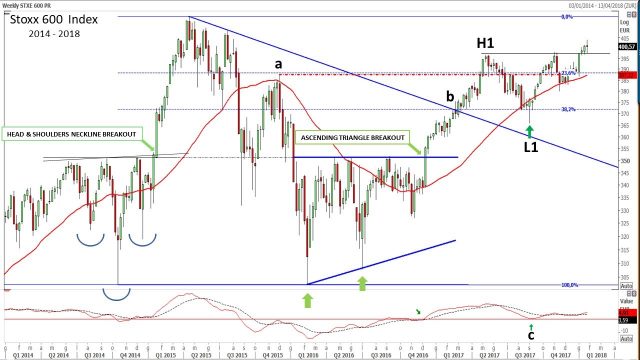
If we consider the movement of the oscillator and we compare it with the past situations, we could note that a pattern emerges: in the last twenty years, when the oscillator comes from an oversold situation of more than -10% and upcross the zero line (see vertical blue lines in the following graph), it tends to retrace towards zero line and then reverse (see green arrows and dotted green lines on the graphs). This usually coincides with a retracement in the price curve (which has historically ranged between 8,97% and 15,73%), which then resumes its bullish trend. The pattern worked also this time as we can see in the point (a).

An interesting evidence that the Index has regained a good strength is that the most part of its Supersector components are returned over their 200 days moving average prices. You can see in the next graph a diffusion indicator, that calculates this condition and when exceeds the level of 12, together with the Macd cross over of the zero line (see in the graph the green vertical lines), we have a signal that generally anticipates a new uptrend: an exception occurred in 2012, where we had to wait a new signal, always in the same year, to have a real confirmation of the uptrend. It is the same situation that it is happening now.

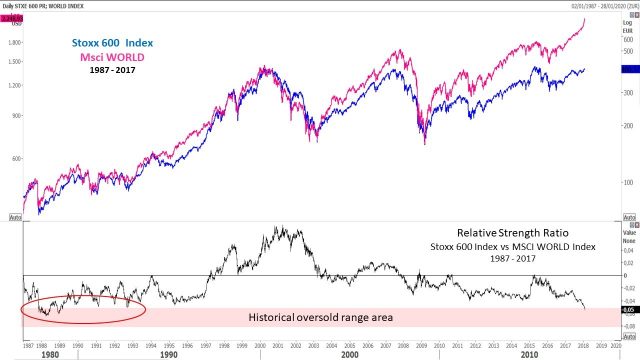
If we evaluate the Stoxx 600 index on the basis of its relative strength versus the Msci World Index, we can reach the conclusion that the advance of this last period it is mainly due to the global strength of the global equity market. In fact, in terms of relative strength versus the Msci World Index, the Stoxx 600 Index is falled at an historical very low value. That could be considered also a kind of oversold zone where some kind of reaction could start.
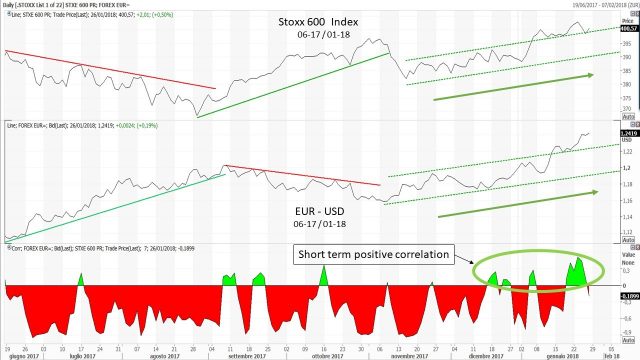
We have two interesting observations, considering the Stoxx 600 Index and the USD. The first is that despite the historical negative correlation between the Index and the cross of the EUR/USD, the last period see the two series positively correlated.
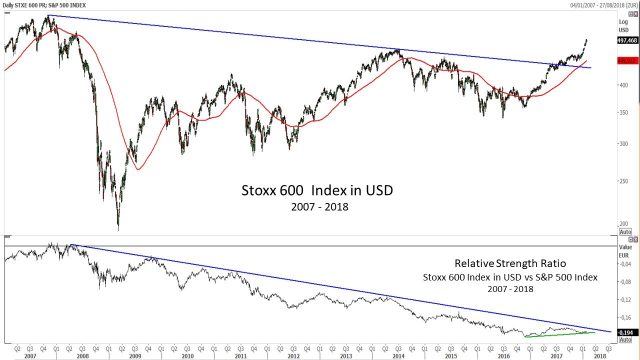
And if we evaluate the index in USD, we can see that the price level broke the historical down trend line and the Relative strength ratio in Usd versus the S&P 500, is rising.
(1) https://www.marketplus.ch/news/stoxx-600-a-positive-but-delicate-construction.html
Mario Valentino GUFFANTI CFTe – SAMT Vice President – Swiss Italian Chapter – mario.guffanti@samt-org.ch
Disclaimer: the above article is for general information and educational purposes only. It is not intended to be investment advice. Seek a duly licensed professional for investment advice.