

The battle between US and China stocks

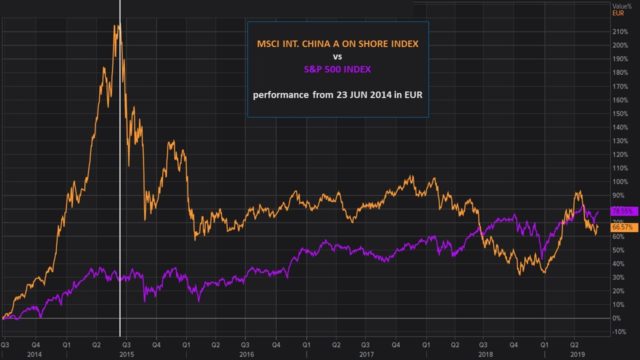
The US-China trade war is a subject of continuous analysis by professional investors, as it heavily affects the entire stock market. Today I would like to propose an analysis a bit ‘different from the usual, but very direct: how is changing in recent years the relative strength ratio between the U.S. stock index S&P 500 and the Chinese stock market (represented by the index MSCI International CHINA A on Shore Index), and how all this can influence in terms of performance an asset allocation in euro that focuses on American rather than Chinese shares.
The following chart contains the Chinese index in the first frame, the American index in the second, and the relative strength of the two indices in the third. When the relative strength drops, the American market performs better than the Chinese one and when it rises, the opposite happens. In a light red field are indicated the periods in which one index performs less than the other.
In terms of relative strength, we can see that the Chinese stock market has been very strong in four periods (r1, r2, r3 and r4), and particularly strong in the period started in June 2014 (r1).

If we look at the performance of the two stock markets to date in euros, starting from the period when the Chinese stock market began its period of relative strength in June 2014 (r1), we can see that the U.S. market beats the Chinese market by about 12 percentage points, but in terms of historical high, the Chinese stock market had in June 2015 (see vertical white line), a percentage difference from the U.S. market more than stellar (+187.82%).
The last period of relative strength of the Chinese stock market, which began in October 2018 (see r4 in the first chart), broke the bearish trend line upwards and seems apparently still present; but if we go to evaluate the situation on a short-term chart from January 2018, we can see that in recent weeks the relative strength has broken downwards the bullish trendline favouring the US stock market (point a), and the indicator is not able to overcome the bearish trendline of the last period (b).
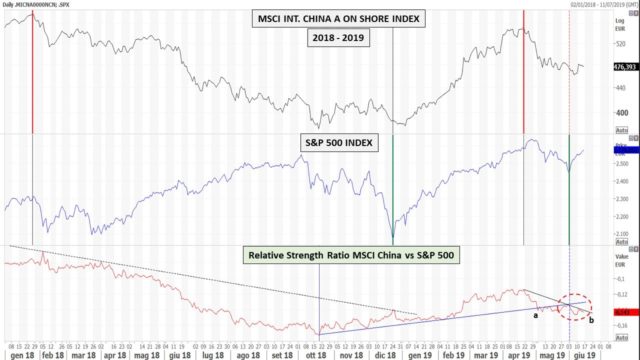
Another interesting observation that derives from the observation of the graph is given by the fact that the Chinese market anticipates downward curve reversals with respect to the American market (vertical red lines), while the American market anticipates upward reversals (vertical green lines).
If we look at the two markets in terms of performance starting from October 2018, which is the last period of relative strength favourable to the Chinese market, we can see that this time the American market is still disadvantaged by 14 percentage points.

It is therefore very important to look at what is going to happen in the next period for a very specific reason. If we look again in the first graph at the periods of relative strength in which the Chinese market outperformed the American market, we can see that the r1 period was characterized by a more than excessive movement. If we instead shift our attention to the next three periods (r2, r3, r4), we can see that the increase has been gradual, but each time longer than the previous period.
It is reasonable to think that the two markets, in terms of relative strength, will continue to alternate in the future as has happened in the past: but the length of the future periods of relative strength of the Chinese market will have to be evaluated, and if they continue to extend their length further and further, this could indicate a new normality in which the Chinese stocks could constitute a new supremacy with respect to the powerful American equity market.

Mario Valentino GUFFANTI CFTe – SAMT Vice President – Swiss Italian Chapter – mario.guffanti@samt-org.ch
Disclaimer: the above article is for general information and educational purposes only. It is not intended to be investment advice. Seek a duly licensed professional for investment advice.