

Trading before quarterly figures

How to take advantage of the Pre-earnings effect.
The announcement of quarterly reports has a particular importance in stock trading when a position is hold over several days. The company usually gives an opinion on how the business development for the current and the coming financial year and thus the fundamental outlook appear. By that means, the publication of quarterly results has a direct – sustainable – impact on the share price. In this article we focus on the question of the extent to which the price action, in the weeks before the quarterly reports, is suitable for equity trading.
Background
Stock companies which are listed on the New York Stock Exchange (NYSE) or the NASDAQ, have the obligation in accordance with stock market regulations, to report on business development during the fiscal year in every three months. This applies also for the companies listed in the Prime Standard of the German Stock Exchange. However in force since 30 November 2015 is that, for the first and third quarter, a quarter release is sufficient (previously quarterly reports were usually significantly more extensive). Depending on which stock exchange a company is listed, the publication will be made according to different accounting principles. A distinction is made between US GAAP (Generally Accepted Accounting Principles) and IFRS (International Financial Reporting Standards).
The use of different accounting principles can lead to different figures in the quarterly report when the company is listed on two different exchanges (for example, on the NYSE and on the Frankfurt Stock Exchange).The easiest way to circumvent this problem, is to compare the current quarterly figures with those of the previous year.
What is being tested?
In this paper, the fundamental data is disregarded. Only the date on which the quarterly figures are published pay is important. This date is usually given known several weeks before the event, by the company. On the Internet there is a wide variety of freely accessible pages which give the date for the announcement of the figures (www.zacks.com for example, www.optionslam.com, www.finance.yahoo.com or www.finviz.com). There are only sites for the US-market given, because the studies in this paper concern exclusively the significantly more liquid US–stock market, compared to the German market. On these sites, the abbreviation “EA” is used in connection with the publication of the quarterly figures, which stands for “Earning Announcement”. In exceptional cases, it may happen that a company temporarily brings the date forward by a few days or even postponed (which is usually considered negative, as this indicates problems in preparing the quarterly figures). The point that a company changes the date for the publication of quarterly results is not considered in the following studies. Instead, it is done as if the date is known in advance at least 30 trading days (ie about 1.5 months) and is no longer postponed. In addition, the question is to be noted, when exactly a report is published: after the market closes (AC: “AfterClose”) or before market opening (BO: “before open”)? For the following studies will make use of a database that contains additional information next to the date, whether the figures have been given known before or after trading. In the case that the database does not contain such information, then the evaluation will not include the evaluation of this earnings-announcement.
The aim of the research (study)
In this article, the price action before the publication of the quarterly figures is at the center. Specifically, the answer to two questions should be found:
1. Are there any shares, which form a typical price behavior before the EA, which is tradable and a mathematical advantage for the entry arises?
2. How could a strategy look like, that exploits this typical price behavior (if anyone exists)?
The research was carried out on the whole, on 31 December 2015, existing US equity sphere. For the purpose of research of highly capitalized stocks, the research is made separately for securities listed on the S&P 100 Index (which of course are also included in the total sphere). With the help of the relevant database is also queried whether a company, at the respective entry day, was actually a member of the S & P 500.
For all researches following applies: Commissions and slippage are not considered. A quarterly date will only be considered, if in the used database in addition to the actual date and an indication is included whether the figures have been published before or after trading hours. The period of the research is exactly six years and goes from 01 January 2010 to 31 December 2015. A total of more than 45,000 quarterly dates are available, of which 30600 meet the following liquidity criteria. In order to be included in the evaluation, a company must meet these requirements the day before the start; otherwise the quarterly date is disregarded:
* The stock price is at the time of the Entry over ten US-dollars.
* The average daily volume over the last 50 trading days is at least 300,000 shares.
Carrying out the studies
In order to assess the pricing behavior, the performance of the stock is evaluated, in the case that, two to 30 trading days before the earnings announcement, an Entry in the stock will occur and will directly be sold to the closing price on the last trading day before the report date.
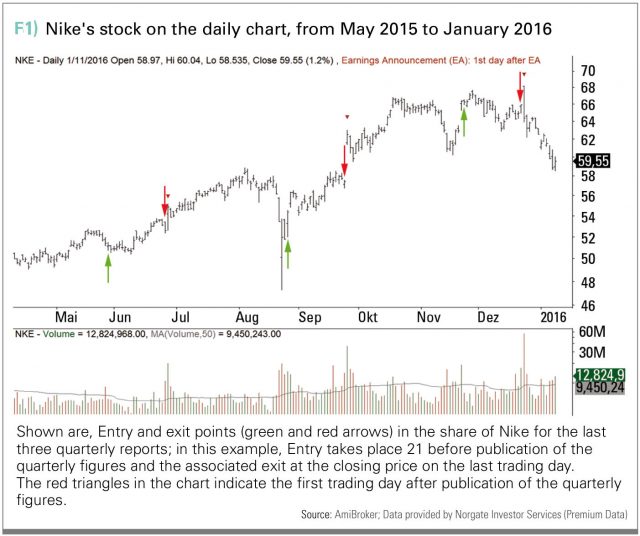
In Figure 1 (ticker symbol: NKE) is based on the last three quarterly reports of the company Nike shown, how a typical entry (green arrows) looks at the closing price 21 days before publication of the quarterly figures and the corresponding exit (red arrows) on the last trading day (the red triangles indicate in each chart the first trading day after publication of the quarterly figures).
In order to assess and to measure the obtained results is the calculation of reference values necessary. So, a benchmark is required. The calculation is performed by calculating the average performance, for a holding period of two to 30 trading days without consideration of quarterly dates, for the entire equity sphere using the aforementioned liquidity criteria. Overall, this gives, in this way of calculation of the Benchmark, 2.2 million trades, since overlapping positions are taken into account. Before entering, the determination of an appropriate position size takes place. Since shares are subject to different volatilities (daily fluctuations), it makes sense to determine the respective position size depending on the average daily volatility. This normalization is in this case performed on the basis of 21 days calculated Average True Range, abbreviated as ATR (21). In the following research results, the size of the position is so determined that an ATR (21) equals to the amount of dollars 250S.
If, for example, the Entry into a stock occurs at a price of 40 US-dollars and the ATR(21) is one day before the Entry at 1.25 US-dollars, the size of the position is calculated to 250 US dollars / 1.25 US dollar = 200 shares. This approach has the further advantage that the movement can be as a multiple of the ATR(21) directly from the evaluation of the performance derived. The performance results from the Entry (X days) before the quarterly report and the Exit directly to the closing price of the last trading day before the date.
Research results
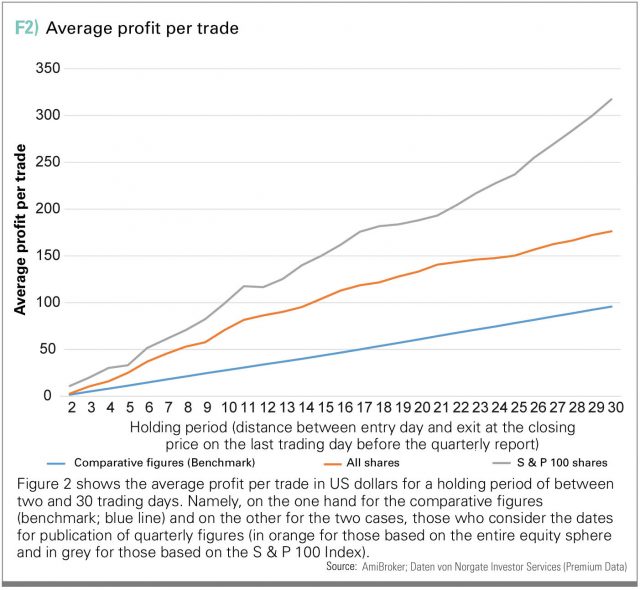
In Figure 2, the average profit per trade in US dollars for holding periods of between two and 30 trading days is shown. Namely, on the one hand the comparative figures (benchmark; blue line) and the other the two cases, those who consider the dates for publication of quarterly figures (firstly, on the basis of the entire equity universe in orange and secondly on the basis of the S & P 500 Index in gray).
If for example, during the mentioned period a company has six days before publishing the quarterly figures, and an Entry is occurred at the opening hours and the position is hold in each case without loss-limit-stop till the closing price of the last trading day before the report date, then results for the entire equity sphere (with the aforementioned restrictions) an average profit of 37 US dollars. If only stocks from the S & P 100 index are taken into account results a value of 51.61 US dollars. The reference value for this period is significantly lower with 14.60 US dollars.
As Figure 2 shows, the difference between the compared increases, the entry on the basis of the entire equity sphere and the entry based on the S & P 100 Index, the earlier before the quarterly report the Entry takes place. The outstanding results for the highly capitalized values listed on the S&P 100 Index, are particularly striking.
Regardless of whether the entire equity sphere or only the S&P 100 shares were considered, figure 2 shows impressively that it may be worthwhile from a mathematical point of view, to trade in advance of publication of the quarterly figures shares.
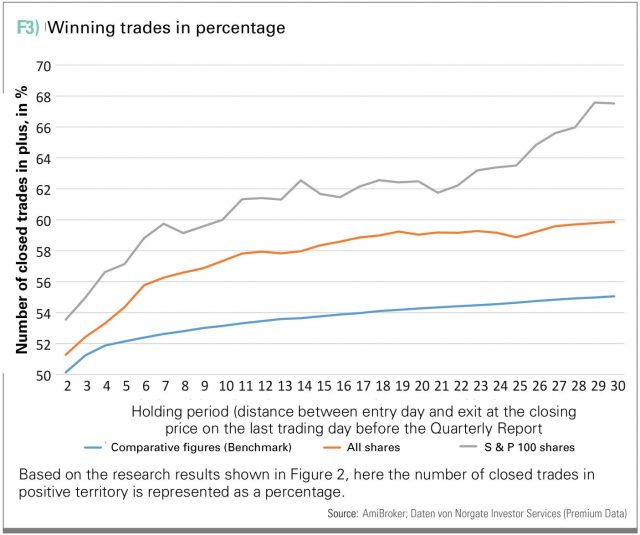
Figure 3 shows the hit rates, resulting for the in figure 2 shown three cases of different Entry-times. So the number of winning trades is (closed at the closing price on the last trading day), for the shares listed to the S&P 100 index, more than 60 percent, if the Entry is carried out at least two weeks before the quarterly figures.
Figures 2 and 3 can give the (false) impression that the reference values may be exceeded with every conceivable technical variant in combination with Earnings Announcements. However, this is not the way.

The use of technical indicators, such as the condition that the Entry into a stock takes place only if the share mark a new 52 weeks high, leads to a significant deterioration of the results. The same applies to the criterion that the closing price of the share must be higher than its 200 days moving average. These are just two of the many studied criteria, all of which do not improve the results shown.
Pre-EA Strategy
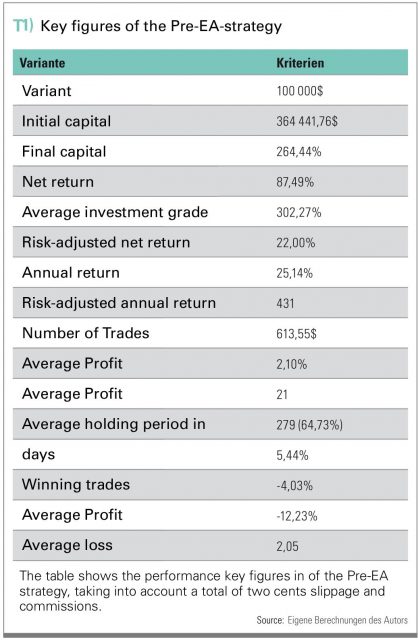
The results shown in Figures 2 and 3 indicate that a strategy, based on the price action before the publication of the quarterly figures Strategy (referred to as “Pre-EA-Strategy” by the author), should focus on the stocks listed to the S&P 100 Index. Based on a 100,000 US dollar account and assuming slippage and commissions of two cents per share each time by Entry and Exit, result during the period 01 July 2009 to 31 December 2015 the performance curve shown in Figure 4 and the performance indicators shown in Table 1.
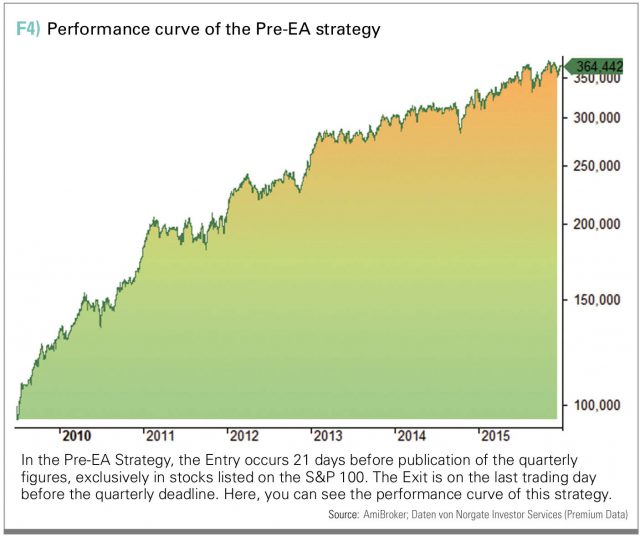
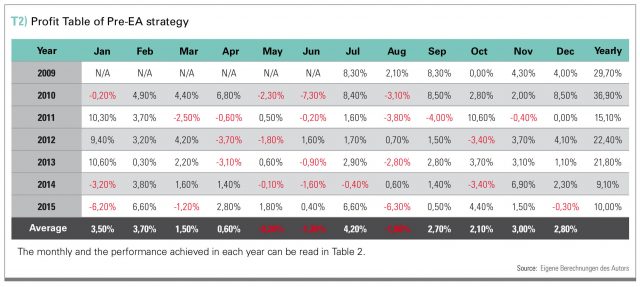
Table 2 shows the monthly performance and performance achieved in each year. Entry occurs respectively 21 trading days before the publication of quarterly figures taking into account the aforementioned liquidity criteria. The position size is calculated analogously to the above research on the basis of the ATR (21) – with the only difference that not constant 250 US-dollars per trade is used as a basis but 0,5 percent of the current account balance. In this way, it is ensured that profits are reinvested. Loss-Limit-Stops and Profit-taking-Stops are not taken into consideration in this strategy-variant (here is plenty of room for own studies). The maximum investment ratio is 100 percent of the available account balance (no purchase on, margin/credit). If there are one day more signals than purchasing power is available, it will be given priority to the stocks with the highest current price. Figure 5 shows the drawdown curve of the simulated performance. With a maximum drawdown, which is well below the average annual rate of return, the strategy is proven to be surprisingly robust during a period which was marked by strong price declines (such as May 2010, August and September 2011, October 2014 and August / September 2015).
Conclusion
Equity trading in the so-called “pre Earnings Announcement” period, so the time window that opens from 30 trading days before the publication of quarterly figures, can be described as very attractive. As the featured studies in this area demonstrate, there is a clearly positive price tendency before the publication of quarterly figures, particularly for highly capitalized stocks. A simple strategy that takes advantage of this effect is to invest for 21 trading days (exactly one month before publication of quarterly figures) in stocks listed on the S&P 100 Index and to hold them till the closing price on the last trading before the quarter report. The determined performance based on such strategy is impressive because of the average annual performance of 22 per cent and because of its robustness (the maximum drawdown is about minus twelve percent) even during difficult market phases.

Author

Article provided by
![]()