

Trading correctly dynamic shares. Take advantage of impulsive movements

On the stock market there are often volume and price jumps. Not all are suitable as an entry signal. In addition to the isolated consideration of such an event, other factors may be decisive for a successful trade. This strategy shows you how to recognize and evaluate the initial event and the framework conditions. Since the company uses day-to-day courses, the approach is not only suitable for full-time traders, but also for part-time traders.
Volume and price breakouts
We use two standard indicators: the volume indicator and the average true range (ATR) *. A simple moving average * is added to the volume indicator over 20 trading days. The common trading platforms allow the insertion and combination of individual indicators. The indicator gives an overview of the current volume relative to the average volume of the last 20 days. A prerequisite for a signal is the condition that the volume reaches at least the triple of the average on the day-closing basis. The factor 3 is an experience value that has proven itself.
A further signal condition is obtained by considering the ATR. This displays our fluctuation range of the course within the last 20 trading days. A signal is generated by the ATR if the current day-closing candle has a margin (high minus low) that is twice the ATR on day-closing basis. If both “hard” conditions (volume and price range) are met, a valid signal is triggered, which does not lead to an entry, but only for the further observation of the title. Price breakouts do not automatically continue on the next trading day. Rather, they merely bring the title into the focus of the market participants, who now weigh up further decisions. Already here are two fundamentally different interests: the one at the beginning, in order to participate in a further course increase, and the profit taking. Depending on which direction is more strongly represented, the price will rise or fall in the next few days. In the overwhelming number of cases, the course begins to decline before continuing the upward movement. This behavior allows us to get an optimal entry.
The entry
In order to maximize the upward movement and reduce the risk that the course will run against us right from the start, we will wait for the decline. In order to define the right time for the entry, we place a Fibonacci retracement * on the day candle, which has met the volume and price conditions. The entry level on the 23 percent level has proven itself here. Here, too, we use the psychology of the market participants. If the general conditions continue to be positive, it can be assumed that the profit-taking has been concluded for the time being and the now “favorable” price mobilizes new buyers. The entry can either be done manually or by limit order. The manual entry, in particular on the basis of day-end closing prices, has the disadvantage that the entry level may have been reached during the course of the trading day, but the course has since then already been able to move significantly upwards and thus the entry was missed. A limit order solves this problem. If you are not comfortable with the limit order, you should place an alarm on the entry level and react promptly.
The exit
The exit is also based on Fibonacci, in this case the 161 percent extension. This is also an experience. Since you need to take a look at the chart before deciding whether you want to take the title into the portfolio, you should be able to make a rough assessment of the price target. It is idle to compute the fluctuation range of the title in the past and to derive a forecast for future movements from this. The view of the chart is sufficient in the normal case. If this results in the fact that it was more sensible in the past to smooth the position with reaching the 100 percent Fibonacci level, then this goal is also recommended in the current trade. Depending on the size of your position, you can also make a partial sell on the 100% level to realize partial profits and minimize the risk. The remaining position is then left in the market to participate in another movement.

Choosing the right title
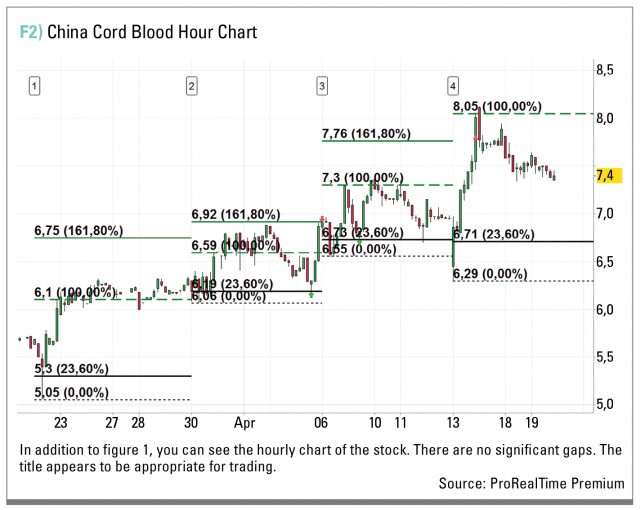
Here you need some basic conditions that you should consider. The title must have an appropriate trading volume. The adequacy is not necessarily tied to a certain value. You can get a good impression by looking at the title on the hour chart. If there are regular gaps (price gaps), leave your fingers off the title. A decisive factor is the spread between buying and selling. You must set this in relation to the planned entry and exit. For example, it makes little sense to buy a value if the compensation of the spreads alone requires a price increase of one or two percent. These factors often go hand in hand. High liquidity means the required volume, reduces gaps and times without trading, and usually also leads to a low spread. As a last criterion, the trading place must be taken into account. XETRA values induce in many brokers lower transaction costs than values traded on the NASDAQ or the NYSE. These costs are also relative to your position or depot size. The higher the latter, the less is the cost.
Money management rules
If you are dealing with equity CFDs (Contracts for Difference), you should not expose yourself too much. The margin is adjusted occasionally. This happens with increasing volatility and also regularly over holidays. Do not use more than 50 percent of the capital as a margin and leverage your account by a factor of ten.
Aids for simplification
Manually looking for these anomalies is possible by filtering volume breakouts or strong changes in the price-course. There are filters on the Internet that provide this feature. Often, however, these filters are restricted to specific markets or issue titles that their own broker does not offer. The simplest way to evaluate and trade is to combine the conditions with an indicator and then to search for exactly these conditions with a screener. This allows thousands of tracks to be searched in seconds.
Example trades
Figure 1 shows the share of the Chinese life science company China Cord Blood. On 22nd March we receive the first signal (1). We place the Fibonacci tool in the daily chart and wait for the 23-percent retracement.
The decline does not happen, we do not enter the market. On 30th March we receive another signal (2). On April 5th, the conditions for the entry are given, the 23 percent retracement is reached. The start is at 6.19 US dollars, the exit with the 161 percent extension at 6.92 US dollars on 6 April. Also on April 6, we receive a new signal on the basis of the day closing price. The entry will take place on April 7th at 6.73 USD. In the further course, the 100 percent Fibonacci extension is first achieved, but the course falls back again. Nevertheless, the position is a success and can be closed on April 13 with the 161 percent extension at a price of 7.76 US dollars. Alternatively, a partial-close of the position could have been made at 100 percent. The massive movement, which led us to the closing of the position, simultaneously provides a new signal (4). Thereafter, the strategy was hold until the 23-percent Fibonacci retracement is reached.
Conclusion
Determining volume and price breakout is a diligence task, but you can simplify it with a few technical tools (indicator, screener). Since the screening is carried out on the basis of day-to-day rates, and the analysis can continue during closed markets, the organisation of time management is very convenient for you as a trader. Even if you do not have the opportunity to react directly to an alarm during the trading hours and place an order on the market, you can handle this strategy with limit orders without any problems. This makes the approach equally feasible for full-time as well as for non-professional traders.
Strategy Snapshot
Strategies name: Volume Price Breakout
Strategic type: Breakout movement Long
Time horizon: hourly and daily chart
Setup: Volume / 3> Volume (20), ATR / 2> ATR (20), long after pullback to Fibonacci retracement
Entry: 23% -Fibonacci retracement
Stop Loss: at your own discretion
Profit taking: optional on 100% -Fibonacci-Extension
Exit: 161% -Fibonacci extension
Risk and money management: maximum leverage 10, maximum 50% margin utilization in the account
Signals per day: 2-3 valid signals per day at universe of 7000 shares
Autors: Marcus Knechtges and Christian Plehn.
Marcus Knechtges and Christian Plehn have already committed themselves to trading on the financial markets years ago. Their main focus is equity and foreign exchange trading. They use their experiences to develop innovative strategies which they use in their own trade. Some of the strategies are publicly available on their website. www.alpha-omega.consulting
Feature article by:
![]()