

What history can tell us about the actual S&P 500 behaviour?

Looking to the financial markets it is always a human game. Fear and greed are always present. In these last periods we can note two human sentiments facing each other: on the one hand, increasing optimism, which is an anticipation of future greed: stock markets continue to rise steadily with such low volatility that the market’s fractality has been temporarily replaced by an incredible linearity.
From the other side we have instead those who feel a deep anxiety, because the markets are so overbought that a correction could be imminent, but the persistent bullish trend continues to deny it.
In general, when we are faced with a new situation we always try to find out whether such a thing has already happened in the past. In the case of the S&P 500 index, looking at its price curve since the early 1900s, we can see that it is already the third time we have been in a similar situation.
Let’s start by describing the type of situation, looking to the graph 1: it is a long period, more than ten years, where the price level is not able to reach new highs and is confined by a static trendline (TL1, TL2 and TL3) The index make an important lower low (LL1, LL2 and LL3), and in a later phase, prices break the trendline and make a new higher low (HL1, HL2 and HL3): it follows a new bullish wave that tends to last for a good period (BW1, BW2 and BW3).
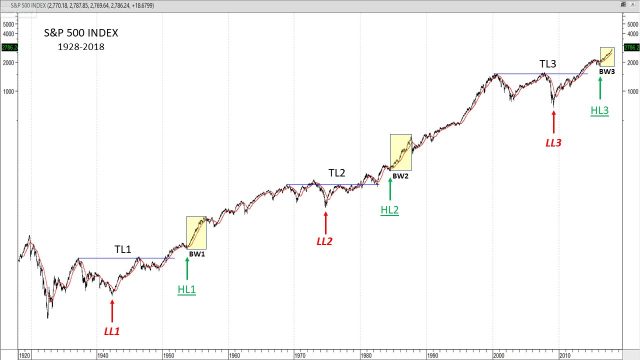
The historical trendlines are built following the technical analysis rule that implies that they must connect two or more peaks or troughs. For this reason, the historical trendline TL1, connects the two important peaks of 1937 and 1946, and has not been chosen the 1929 peak.
The next step is to measure in terms of time and performance, two fundamental periods that have occurred in the three situations. The first period measured is that of the bullish wave born from higher low, immediately after the price breakout of the 200 days moving average (BK1, BK2 and BK3 in graph 2), up to the peak of the wave (PK1, PK2 and PK3).
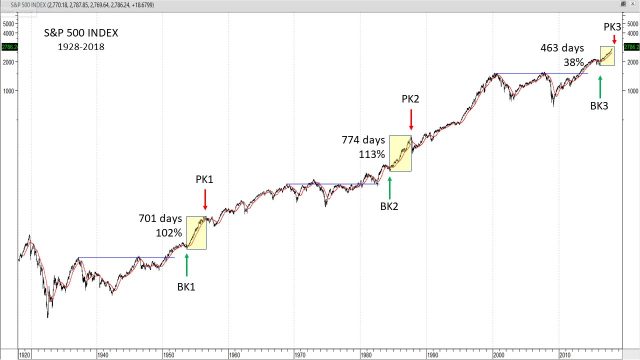
As we can well notice, the current period is lower in terms of both time and performance than previous periods. The two previous periods, however, are fairly similar, both in time and performance.
Let’s measure now the second period, starting from the most important lower low, as indicated in the graph 1 (see LL2, LL2 and LL3 in graph 3), always until the peak of the wave (PK1, PK2, and PK3).

Here too, the actual period is lower in terms of both time and performance than previous periods.
Can this brief historical analysis therefore suggest that the trend of this last bullish wave can still continue, given that in the past periods both time and performance have been longer? On the one hand, I cannot see past events as predictive for the future. However, these are always price patterns, always built on the behaviour of the markets, where the human variable tends towards a certain repetitiveness, as behavioural finance and technical analysis teach us. We can therefore consider this study as a probabilistic description to be taken into account in our future investment strategies
Mario Valentino GUFFANTI CFTe – SAMT Vice President – Swiss Italian Chapter – mario.guffanti@samt-org.ch
Disclaimer: the above article is for general information and educational purposes only. It is not intended to be investment advice. Seek a duly licensed professional for investment advice.