

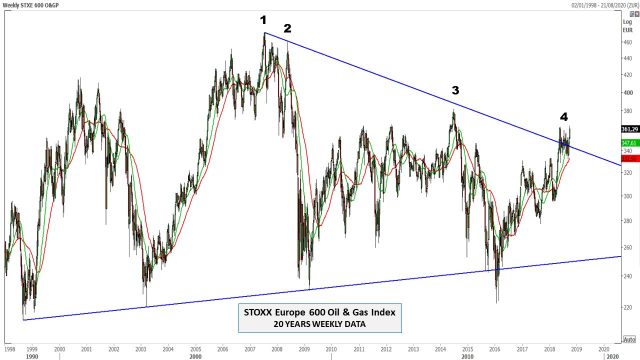
STOXX Europe 600 Oil & Gas Index and trendlines
Trendlines are one of the simplest tools used in Technical Analysis, and generally one of the most effective when a chart is analysed. When a price breaks a trend line, this requires our attention.
Looking to the last twenty years of the Stoxx 600 Oil & Gas Index, we can connect the historical peak of July 2007 (1) and the lower high of May 2008 (2) projecting the down trendline from there.
We can see that a new price peak almost touched the trendline in July 2014 (3), but the most interesting situation is developing since May of this year, where a real area of congestion has been created around the trendline (4).
The prices of the index are obviously related to the price of oil. It is interesting to note, as we can see from the following chart, that the 50-periods correlation between the index and the Brent futures is at its highest since 2015. It is reasonable to think, if the correlation continues, that the continuation of the upward trend of the Brent will allow the index to break with decision the downward trendline.

Mario Valentino GUFFANTI
CFTe – SAMT Vice President – Swiss Italian Chapter – mario.guffanti@samt-org.ch
Disclaimer: the above article is for general information and educational purposes only. It is not intended to be investment advice. Seek a duly licensed professional for investment advice.