

Europe Basic Resources Supersector: the story continues

I am closing this year with a piece dedicated to a promiseful but sneaky Supersector about which I have already discussed in two previous articles (see note 1).
Let’s start with the promiseful side: in mid May, I wrote about the STOXX Supersector Europe 600 Basic Resources Index, and the possibility for this Index to continue an intermediate uptrend after the end of a retracement period that started in late February (1).
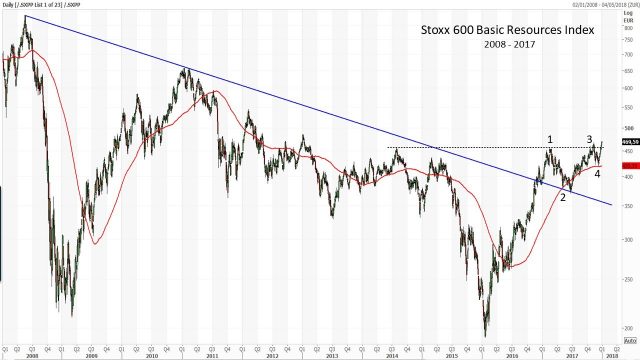
The consolidation begun on the first of the three support that I indicated in my previous article: the historical long-term downtrend line that coincides with the 200-day moving average (2). In the following months the price level tried to overcome the February high without success (3), dropped until the 200 day moving average (4), and in the last weeks finally overcome the February high. This is a good start, but this index in the past, around this price level, has always given quite ambiguous signals.
In fact, if we look to the same graph, adding also the Relative Strength ratio, we can consider now the sneaky side.
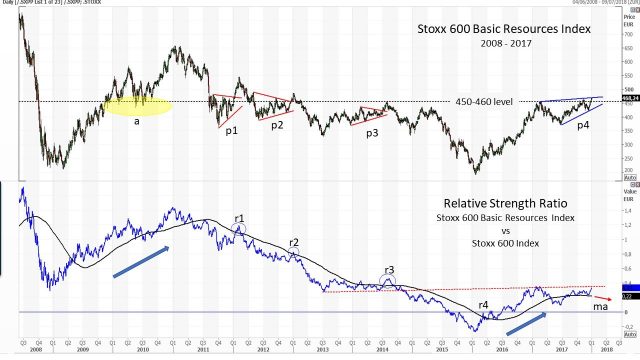
As we can see, the 450/460 price range, has always been in the past a support and resistance level. In all 2010 has been a good support level (see the yellow area “a” in the graph), in the following years the range played more the role of resistance level. Prices have always moved around it creating triangles patterns in three occasions (upper graph, p1, p2 and p3). But the upward breakout of these patterns never worked very well. Among other things, in this last period a raising wedge (bearish pattern) is being formed (p4).
A more comprehensive explanation can be given using the Relative Strength ratio. As we can see, all the triangle pattern breakouts (upper graph, p1, p2 and p3) are accompanied by false breakouts of the Relative Strength Ratio with respect to its 200 day moving average (bottom graph r1, r2 and r3). Only in the bottom graph r4 point we had enough strength to stay above the moving average, that turned positive as in 2009-2011 period; but as we can see in the last months, it has become slightly negative (ma) and therefore there is a need for the ratio to exceed the resistance zone indicated with the dashed red line.
A future increase in the Relative Strength Ratio above the indicated resistance, could bring more benefit to the “promiseful side”.
(1)
https://www.marketplus.ch/news/europe-basic-resources-supersector-an-index-to-watch-closely.html https://www.marketplus.ch/news/europe-basic-resources-supersector-a-trend-reversal-has-begun.html
Mario Valentino GUFFANTI – SAMT Vice President – Lugano Chapter – mario.guffanti@samt-org.ch
Disclaimer: the above article is for general information and educational purposes only. It is not intended to be investment advice. Seek a duly licensed professional for investment advice.