

Fresh Bullish Signals from the European Equity indexes

The European equity indexes are delivering bullish signals in these early sessions of 2018, even if some weakness at the end of last year gave room to concerns regarding the persistence of the trend.
The European markets, which performances have been generally positive but much less euphoric than those of Wall Street, have been laggards in 2017. Rather than a linear uptrend, like that of the U.S. benchmarks, the main equity indexes in Europe were roller coasters along the year. A corrective wave during the summer corresponded to the sharp rally of the Euro against the U.S. Dollar and this is not a coincidence: a stronger currency, as everyone knows, does not help the stock market.
Nevertheless, the final round of the year delivered the long-awaited recovery signals, allowing the European equity indexes to turn bullish again.
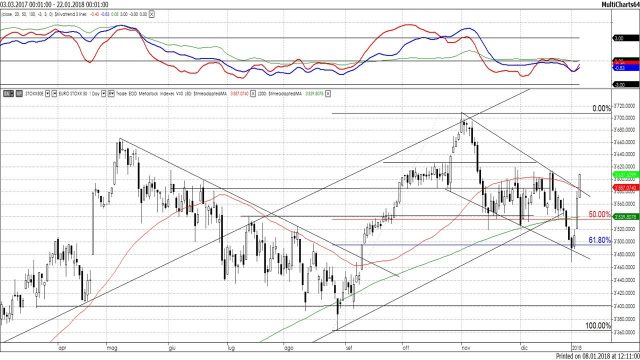
Figure 1: Eurostoxx50, daily data since March 2017. The down-trending channel has been broken on the upside. A bullish divergence is visible between price and momentum indicators at short term (red line on the top of the chart). Source: Tomaselli Vivanti Analysis – Chur
The Eurostoxx 50 has rallied from the bottom of the down-trending channel originated by the October’s high. It should be noted that the failure of the 200 days average at the end of 2017 had provided a bearish signal which effect had lead to a cyclical bottom at 3480. A bullish divergence between price and momentum indicators is now developing and this positive reversal reinforces the bullish outlook with resistance around the November high in the 3700 area. The December highs at 3620 represent a recurring resistance that could likely generate a pause in the rally due to the excesses of the current run-up.
A similar bullish pattern is visible on the German DAX that has been quite volatile in December. The false breakout of mid-December above 13200 was followed by a fall to the support of the medium-term trendline. Then a cyclical bottom, with a bullish divergence similar to that of the Eurostoxx50, allowed the DAX to break above the November-December negative trendline. Next resistance, also in this case, the 2017 highs, the major support is once again the recent low at 12750 (at 12635 the 200 days moving average)
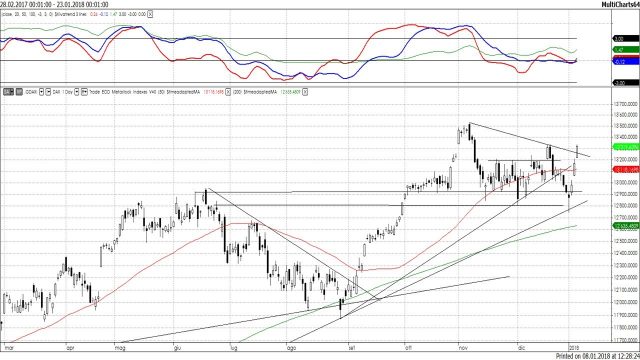
Figure 2: DAX German Index, daily data since March 2017. The down-trending channel has been broken on the upside. A bullish divergence is visible between price and momentum indicators at short term (red line on the top of the chart). Source: Tomaselli Vivanti Analysis – Chur
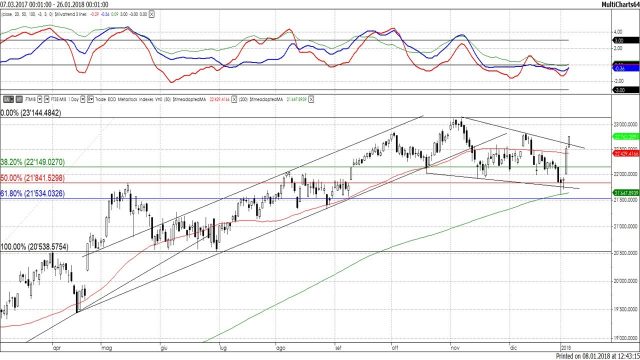
Figure 3: Italy’s FtseMib, daily data since March 2017. The falling wedge that developed in the latter weeks of last year has concluded with a rally above its resistance 22500. Source: Tomaselli Vivanti Analysis – Chur
A bearish mood had also dominated the Italian index FtseMib during November and December. The sequence of progressively lower highs and lows has formed a falling wedge, a pattern which conclusion is generally bullish once is resistance line is broken. This is what happened at the end of last week, when the FtseMib broke above 22’600, opening the way to the recent highs in the 23’000 area. The next main resistance, nevertheless, stays near the 2015 highs, around 24’000.
Alberto VIVANTI – SAMT Vice President – Graubünden and Liechtenstein Chapter– alberto.vivanti@samt-org.ch
Disclaimer: the above article is for general information and educational purposes only. It is not intended to be investment advice. Seek a duly licensed professional for investment advice.