

A closer look to CRB Industrial Metals Equity Index

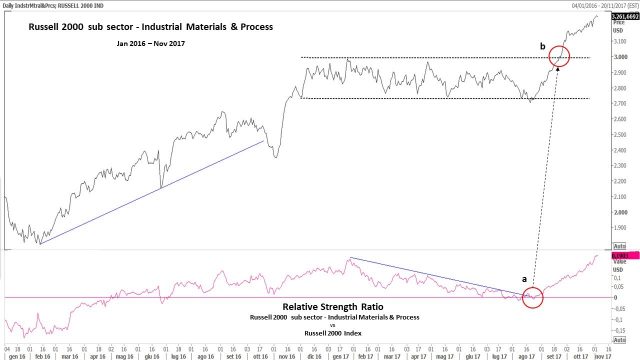
In my last October article about the Russel Index (1), I pointed out that looking at the last two years charts of Russell sub Sectors, in the last month the strongest one in terms of Relative strength was the Russell Industrial Materials & Processes. From the following chart we can see that Relative Strength ratio, at the end of August, anticipated (a) the breakout of the trading range price channel (b) begun in late 2016, and until now the situation hasn’t changed.
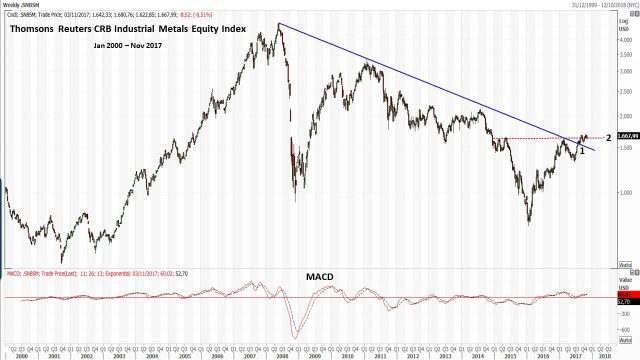
Looking for a wider Index which involves industrial materials, I have noticed that one of the most interesting equity indices on this topic, is the CRB Industrial Metals Equity Index. I’ve analyzed the Thomsons Reuters CRB Industrial Metals Equity Index, that we can see in the following chart in a long term view. We have a nice break of the secular downtrend line (1) and the price level is around an interesting area, touched many times in the past (2).
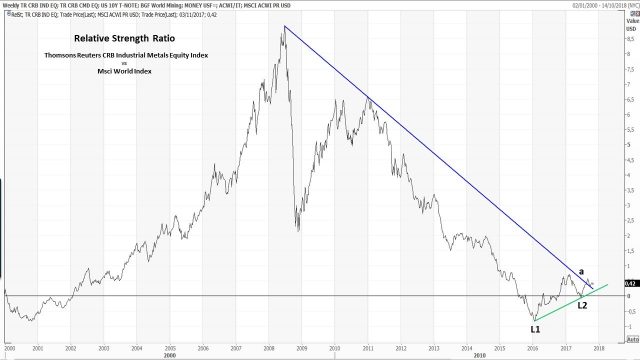
The same is for relative strength, that had a breakout of the secular downtrendline (a), with a higher lows construction (L1 e L2).
The index was born at the end of 1999, so we haven’t a long history, but I’ve noticed that, when the US Dollar Domestic Interest Rate had a reversal with rising interest rates, in the same period the index was in uptrend (see yellow area in the next graph).

(1) https://www.marketplus.ch/news/stalking-on-the-russel-2000-index-what-s-next.html
Mario Valentino GUFFANTI CFTe – SAMT Vice President – Swiss Italian Chapter – mario.guffanti@samt-org.ch
Disclaimer: the above article is for general information and educational purposes only. It is not intended to be investment advice. Seek a duly licensed professional for investment advice.