

A Reversal Pattern in the U.S. Dollar that Deserves Attention

The U.S. Dollar has concluded last week a long bottoming process after confirming an interesting reversal pattern. In the chart of the Dollar Index (Figure 1) a so called inverse head-and-shoulders is visible, a technical pattern that anticipates a possible reversal of the negative trend that culminated with the 32 months low of last September at 91. After then, a progression of growing lows has reached, and exceeded last week, the key resistance of the pattern described (94.25).
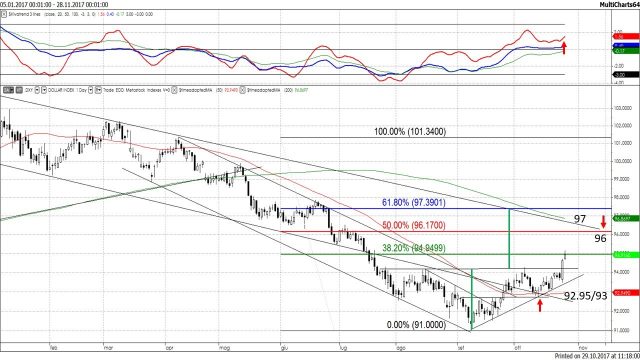
Figure 1: the U.S. Dollar Index, daily data since January 2017. Source Tomaselli-Vivanti Analysis – Chur
In this pattern, the so called shoulders are the lows of early August (92.55), and October (92.75), where the head is the lowest low at 91. The line that connects the two highs of August and early October around 94.25 is the neckline, the resistance above which a bullish signal has been generated.
According to the classic rules of technical analysis the target is given by the projection of the distance between the neckline and the lowest low, measured above the resistance, in the case of the Dollar Index 94.25- – 91 = 3.25; 94.25 + 3.25 = 97.5. It is curious to note that this level corresponds to the Fibonacci retracement 61.8% of the former bearish extension April-September. Any price target in Technical Analysis should be considered as a rough guide, since other intermediate levels are also important resistances: the 50% Fibonacci retracements at 96.22, the 200 days moving average actually at 96.87.
Often, after the breakout, a corrective pullback occurs as a profit taking reaction. A re-test, and even a move below the former resistance is not to be excluded. What is most important, so that the bullish pattern is not denied, is the withstanding of the mayor support of the October low 92.75 (the 50 days moving average is also a support around 93).
The same analysis applies to the parity Euro/U.S. Dollar (Figure 2), with the difference that the price series is denominated by the side of the Euro and so the bullish move of the dollar corresponds to the bearishness of the euro and the head-and-shoulder is not inverse. So, the highest high of September (1.2014) is the head, the two shoulders stand at 1.19/1.1880, the neckline at 1.1665. The graphical target is in this case at around 1.13, a major support corresponding to the intraday high of November 2016, not far from the 200 days moving average, actually at 1.1243 but still growing. An earlier important support is the 61.8% retracement of the June-September rise, at 1.15. The resistance above which the bearish pattern would be compromised is the October high 1.1880.
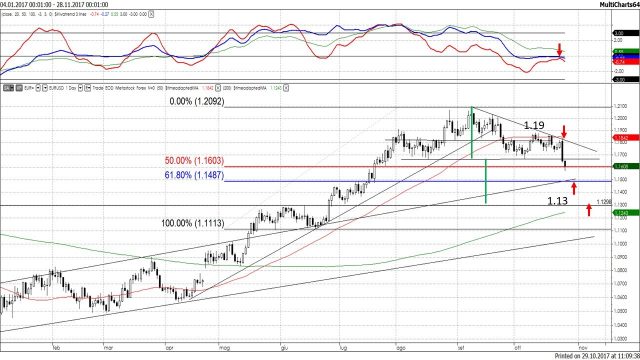
Figure 2: the Euro – U.S. Dollar parity, daily data since January 2017. Source Tomaselli-Vivanti Analysis – Chur
Alberto VIVANTI – SAMT Vice President – Graubünden and Liechtenstein Chapter– alberto.vivanti@samt-org.ch
Disclaimer: the above article is for general information and educational purposes only. It is not intended to be investment advice. Seek a duly licensed professional for investment advice.