

Black Swans

The nightmare of all traders and investors.
It happens when you do not expect it and it causes enormous damage – talking about the so-called “black swan”. What is going on with this phenomenon in the financial markets and whether you could receive warning signals using technical analysis, you will learn in the following article focused on the example of the Volkswagen share.
What is a Black Swan?
Although the metaphor is old, the worldwide spreading of the term “Black Swan” took place only with the publication of the books by Nassim Taleb. The author – also trader and professor of risk management – describes with the Black Swan an event, which is highly unlikely, and therefore mistakenly ignored. But if such an extreme event occurs, the consequences are extreme. A high vulnerability to Black-Swans can be observed especially to capital markets participants that actually are not from a strictly scientific point of view, because the Black Swans do not belong to the category of “unknown Unknowns”.
We remain as relevant to practical experience as possible and focus on the core message. The development of the US-Real Estate-Markt before the financial crisis 2007/2008 can serve as an example:
For generations, housing prices rose year on year in the air. From this experience, nobody could have imagined that a collapse will come. Just as centuries ago, European settlers thought that there are only white swans (finally, they had seen until then no different-colored swans), the same way real estate securities were deemed to be safe. The associated risks were by lenders, borrowers and investors ignored – until the decline in home prices came. The European settlers were convinced when travelers in Australia found black swans. a single observation cannot throw out a theory which is based on long-term empirical basis. The following quote from Gabor Steingart (Handelsblatt) provides the perfect description of the Black Swan: “If the black swan lands, it will break not only our certainties. It will destroy them. A Black Swan symbolizes the great disaster which ends the previous normality.
Black Swan Nr.1: Free floating of the Swiss franc
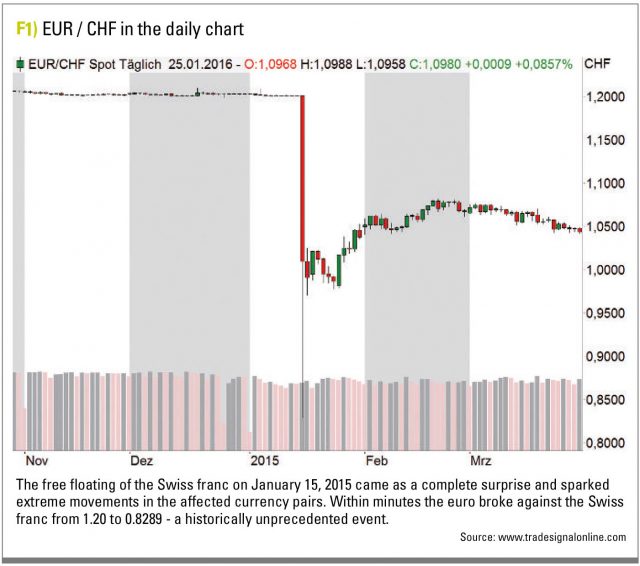
A first class Black Swan was observed at the beginning of the trading year, 2015. The trigger: The Swiss National Bank cancelled on 15 January 2015 the minimum rate of 1.20 francs per euro. The result: From 10:30 to 10:47, the euro broke against the Swiss franc from around 1.20 to 0.8289 and returned to the end of the day above parity. Figure 1 show how hard this daily movement was in comparison to the low trading margins of months, before the event. This day brought significant life-threatening losses to numerous market participants – both private and institutional. The abrupt direction-turn triggered heavy turbulences in the stock market: The Swiss benchmark index SMI fell almost 14 percent and thus marked the most volatile trading day in its history.
Black Swan no. 2: Exhaust gas scandal at Volkswagen

No other share in DAX as Volkswagen was in 2015 the focus of the media and market participants. Here, the Black Swan struck in September: The company, which was always considered as a pioneer in clean technologies, confessed publicly to have tampered with illegal practices, the exhaust emissions of its vehicles. An affair of this importance had the consequence of halving of the course within few days. But what could somebody know in advance using the technical analysis? Have there been previous indications of a downward movement in the VW share? Let’s look at image. 2. As can be seen here, after forming an all-time high in March 2015 at 262.45 Euro, the VW share begun to reverse and a downward trend established increasingly itself. One day before the day X, a bearish price pattern was also seen in the chart that implied a further slip to the low of the previous year. Summarizing the above, it can be said that: The stock was for some time in a negative trend, so taking long positions was not recommended. We must turn our attention to Figure 3. This time a longer price history as a weekly chart is shown. You can see now the price reaction after the announcement of exhaust affair. After breaking the aforementioned support with a Gap (1) a massive crash began that easily broke through the next lower support (2). Only in the field of the deeper support line from 2011 (3), the panic sell-off found an end. The price level of the stock had been approximately halved at this time; measured from the peak of the stock value, only about one-third was left.
Risk and money management can limit the damage
Whether it is the crash in the US stock market in 1987, the historic one-off appreciation rally in the Swiss franc or the crash of the Volkswagen share – the timing and characteristics of the so-called “Black Swans” cannot be fully determined. Black swans are distinguished by their unexpected appearance. Using different forms of analysis you can limit the potential damage of such extreme events in the depot. This includes trend analysis and price pattern analysis, the use of resistance lines and support lines as well as many other tools, such as seasonality. An effective damage limitation is only possible if one has a solid risk management and money management and the possibility of hedging, when it is necessary.

Conclusion
To go back to the example of the Volkswagen share: Traders, who had consistently placed their stop in the support line, had to accept bad performance due to the price gap. In retrospect, these market participants were likely to be glad to have come with a black eye from the Trade, instead of having to watch the entire crash. Others who have followed the trend, saw in the price patterns an attractive short opportunity. What a Black Swan is for one side may be just the opposite for the other side. In this sense: Be prepared for more extreme events and manage your risk! «
David Pieper David Pieper has the Analyst Diploma CIIA and is an active trader since the late 1990s. He focuses on the development of trading systems and is a freelance writer in the field of capital markets. www.trade4life.de
B1) EUR / CHF in the daily chart
EUR/CHF Spot daily
The free floating of the Swiss franc on January 15, 2015 came as a complete surprise and sparked extreme movements in the affected currency pairs. Within minutes the euro broke against the Swiss franc from 1.20 to 0.8289 – a historically unprecedented event. Source: www.tradesignalonline.com
B2) Volkswagen preferred shares in the daily chart the day before the crash
The VW shares started in the spring of 2015 a downward trend – look at the trend line (red double line) and the falling moving average (Simple Moving Averages in blue, green and gray). In this downward phase the DAX-value generated also a bearish price pattern that signaled another case. Source: www.tradesignalonline.com
B3) Volkswagen preferred shares after the crash in the weekly chart
After breaking the support with a Gap (1) began a massive crash that easily broke the next lower support (2). Only in the field of the support line from the year 2011 (3), the crash found its end, however, the technical chart damage was immense. Source: www.tradesignalonline.com
Author:

Feature article by:
![]()