

Gold could bounce late December, but should remain under pressure until late Q1 2018

Gold has taken a bit of a dive over the last few weeks and more generally since September. In our view, it is suffering from the bounce we’ve seen, to various extents, since early September, on reflationary assets (US long term rates, the Dollar, Oil). We hereby review these dynamics with a 3 months and 12 months view.
Gold – Weekly Graph or the perspective over the next 2 to 4 quarters
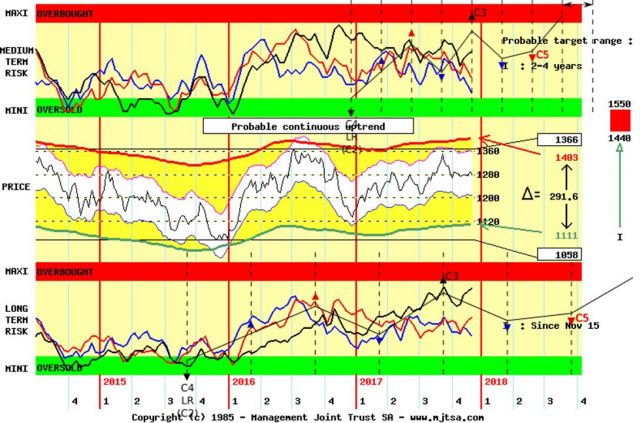
On both our oscillators (lower and upper rectangles), we have probably reached an intermediate top on Gold between September and a few weeks ago. Both suggest that Gold may now remain under pressure until mid/late Q1 2018. The price potential for the correction down can be estimated as 0.5 times our historical volatility measure “Delta” (here at 291.6 USD/oz; middle rectangle; right-hand side), subtracted from the 2016 tops (here at 1’366 USD/oz). This calculates to 1’366 – (291.6 * 0.5) = 1’120 USD/oz, which we would consider as a strong support level for Gold over the next few months. Following that, as shown on both our oscillator series, we expect Gold to resume up its uptrend from the Spring and to gradually accelerate up towards year-end 2018 and our I Impulsive Targets up around 1’500 USD/oz (right-hand scale)
Gold – Dailly Graph or the perspective over the next 2 to 3 months
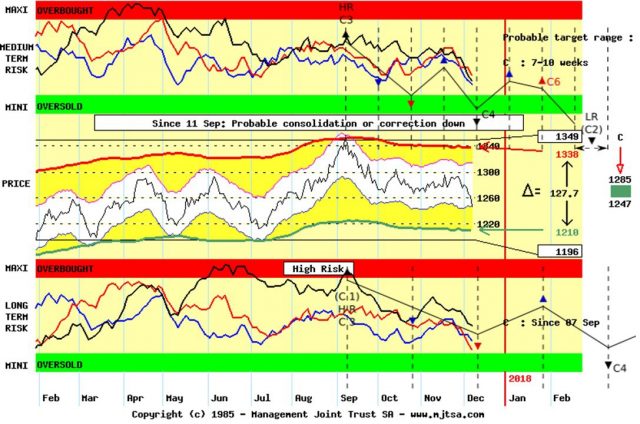
On this Daily graph, the current Gold sell-off is clear to see. According to both our oscillator series (lower and upper rectangles), it could reach an intermediate low between now and mid December and experience a slight bounce during the last weeks of 2017. Following that, from January, Gold should resume its downtrend towards late February/March. On the price targets front, over the last few days, Gold has reached our C Corrective down targets slightly below 1’247 USD/oz (right-hand scale). These should provide some support over the next couple of weeks, yet following that, Gold should move lower towards our I Impulsive targets down (between 1.3 and 1.7 time “Delta” subtracted from the tops) in the 1’183 and 1’132 USD/oz range. This pretty much corresponds to the one we calculate above on our Weekly graph.
Concluding remarks:
Our general view is that before equity markets top out between end Q1 and mid next year, reflationary assets should see one last attempt to push higher. Since September, this is currently happening, although at slow pace and only gradually. This weak reflation trade may pause over the next couple of weeks, but should continue higher, probably towards mid Q1 2018. Gold is on the other side of that trade and should hence first rebound a bit and then suffer again into Q1. Following that, Gold should resume its uptrend and gradually gather pace during the rest of 2018.
Jean-Francois Owczarczak CFTe – SAMT Assistant Vice President – Geneva Chapter – jfo@samt-org.ch
Disclaimer: the above article is for general information and educational purposes only. It is not intended to be investment advice. Seek a duly licensed professional for investment advice.