

Gold: is it time for a cup?

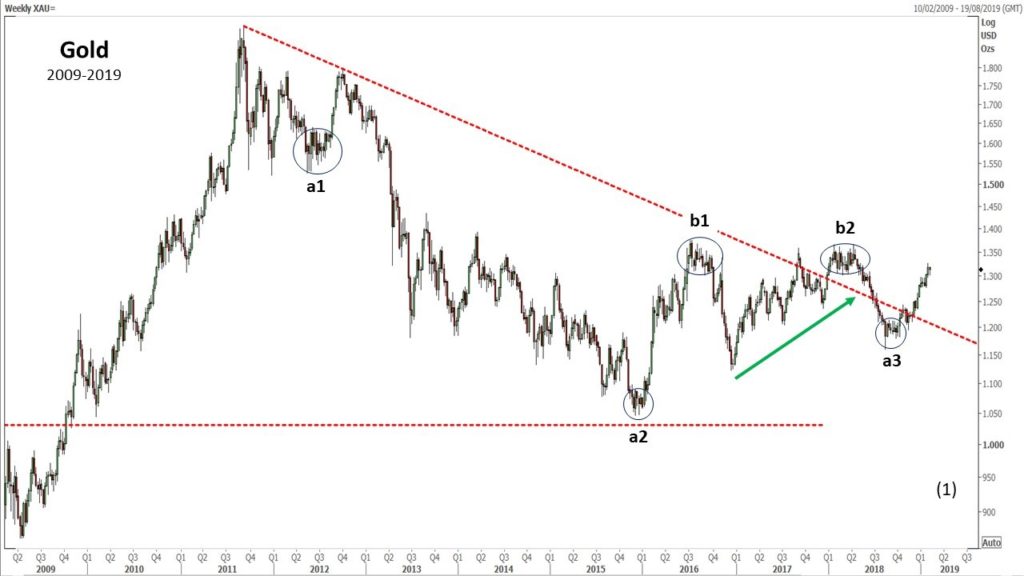
In October 2018 I wrote an article on gold pointing out that the October low was formed after a price consolidation that lasted several weeks (a3). Such a pattern has been observed two times since 2011, and in both previous cases it was the forerunner of a short-term bullish trend (a1 and a2). The same consolidation pattern could also be detected at the opposite, i.e. in top situation that have then led to short term downtrend as in the points b1 and b2.
The difference between this pattern (a3), and the pattern located in the point a1, is that this time it was formed after a year and a half of gold rally. This is the first rule for identifying a pattern that has been made famous by William O’Neil and is described in his “How to Make Money in Stocks” (McGraw-Hill, 1995): the Cup-with-a-Handle pattern.

This price pattern looks like a cup with a right handle. It lasts, in time duration, from 7 to as many as 65 weeks (most are usually three to six months). The bottom part of a cup pattern should be rounded and give the appearance of a “U” rather than a very narrow “V”. The forming of the handle is usually more than one or two weeks in duration and it is the classical period of profit taking in which both volume and price go quiet. Finally, the handle is completed and prices explode to the upside. Generally a price drop in a proper handle should be contained within 10% to 15%.
By its very nature, the cup with a handle is a consolidation formation that could confirm the up trend started at the beginning of 2016. Another good indication is that the price is returned above the short term up trendline (see point 1 in the graph below).

But some caution must be considered because price is approaching a very critical topping area around 1350 level. It is true that in the last weeks the 50-day moving average up crossed the 200-day moving average (a2) and the Macd upcrossed the zero line (b2): the same happened in 2012 (see a1 and b1), but the price didn’t have enough strength to overcome the level of resistance of the topping area, forming a lower high of a bear market. The 2012 pattern couldn’t not be considered a Cup pattern, because we hadn’t a rising trend in the months preceding its formation.

Mario Valentino GUFFANTI CFTe – SAMT Vice President – Swiss Italian Chapter – mario.guffanti@samt-org.ch
Disclaimer: the above article is for general information and educational purposes only. It is not intended to be investment advice. Seek a duly licensed professional for investment advice.