

Is a Flattening Yield Curve Really Dangerous?
Did you know that one of the most popular keywords in the Google searches last month, was “yield curve flattening”? There is a lot of discussion these weeks about the narrowing spread between the long and short term maturities in the Treasury Notes yields.
Such a spread has shrunk at the lowest levels since 2007. Why is this a cause of concern? The yield curve is the difference in reward the investors receive for locking their investments for longer periods of time, which means greater uncertainty. A compensation for investors who tolerate the extra risk is usually called risk premium. But when such premium fades away then the yield curve is flat, when the spread is negative, the curve is inverted.
The yield curve reflects the market’s feeling of the economy, especially about inflation. If the investors perceive that the inflation is poised to increase they will demand a higher yield for the longer maturities in order to offset the negative impact of a deteriorated purchasing power. On the other hand, a flat or inverted yield curve is usually anticipating an economic slump, like it happened ten years ago. It has to be noted that the spread turned negative before each of the last seven recessions. Since the beginning of 2017 the difference between the 10 and 2 years notes yields narrowed form a high a 1.35% one year ago to 0.50% (Figure 1).
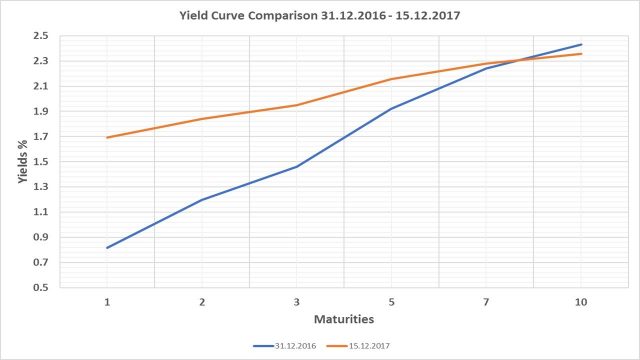
Figure 1: T.Notes yield curve for maturities between 1 to 10 years. At the end of 2016 (blue) and at mid December 2017 (orange). Source Tomaselli-Vivanti Analysis – Chur
What does it mean? The Federal Reserve has started a round of short-term rates increases in response to an improving economy, and this is why the short end of the curve is rising. On the other hand, the inflation is running below expectations, and the yields at long term don’t follow the shorter maturities in the rise and the difference between the two is shrinking. Perceived inflation risk could reverse if inflation started to trend up, and so the Fed hopes and wishes, and the effect of Trump’s fiscal stimulus could help. Nevertheless, concerns about a slowing economy, if not even a recession, are there. Some observers fear that the long dated bullish season in the stock market could be about to end. A look at the past is helpful to understand to which extent such fears are justified.
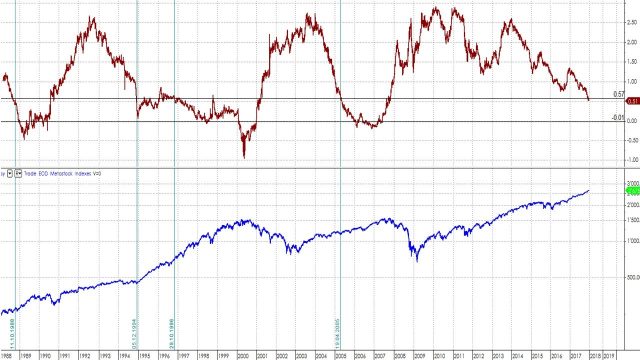
Figure 2: T.Notes spread 10-2 years. (top). Standard & Poors 500 stock index, logarithmic scale (bottom). Historical data starting 1988. Source Tomaselli-Vivanti Analysis – Chur
It is true that a yield curve turning into negative values, often anticipates a downtrend at Wall Street. It is also true that the market needs time to react. The chart of Figure 2 shows that today’s spread is not yet at zero but has reached the lowest value since 2007. The vertical lines in the chart pinpoint similar past occurrences. The yield curve 10/2 fell at 0.5 in 1988, at the end of 1994, in 1996 and in 2005. When it happened, it took time for the S&P500 to reverse its up-trend, sometimes years.
In conclusion, this fall in the spread between the yield of the 10 and 2 years Treasury Notes deserves attention, but it does not look like a forthcoming bearish signal for the U.S. equity markets. On the other hand, a correction after so many months of constant uptrend is not to be excluded.
Alberto VIVANTI – SAMT Vice President – Graubünden and Liechtenstein Chapter– alberto.vivanti@samt-org.ch
Disclaimer: the above article is for general information and educational purposes only. It is not intended to be investment advice. Seek a duly licensed professional for investment advice.