

Safety of the “Defensive” Swiss Market (SMI) Index

The SMI may stall in the short term near 9750, where goes the resistance trendline joining 9537 in 2015 and 9616 in 2018. But the wide rising ascending triangle built since mid-2015 has an even higher long-term potential. Medium term, let say for the next 12 months, the pullback in 2018 from roughly 9600 to 8500 allows to envision a rise toward 10765, once a base is built above 9600!
As the SMI is testing the major resistance area of 9725-9750 along rising monthly MACD & STO without displaying bearish divergences, thus suggesting a still-intact upward momentum. Besides a possible pause short term to retest former High near 9616, the SMI may reach 10000 later this year and then display a bearish divergence calling for the usual seasonal low in the Fall. But keep in mind the longer-term UPTREND since 2009 and the wide ascending triangle since 2015 have target above the medium term projection at 10765.
Even if the SMI should display once a pullback between 9500 and 9135, it could be well be viewed as an opportunity to “Buy the Dip “within a rising trend. Possibly some international investors are already reallocating toward Swiss assets as the recently bout of strength of the Swiss Franc versus Euro could be coming to an end, suggesting less Risk Off attitude in the market .
In a global financial world where uncertainty was the buzzword of 2018, Safety of Swiss Equities may become a next mantra.
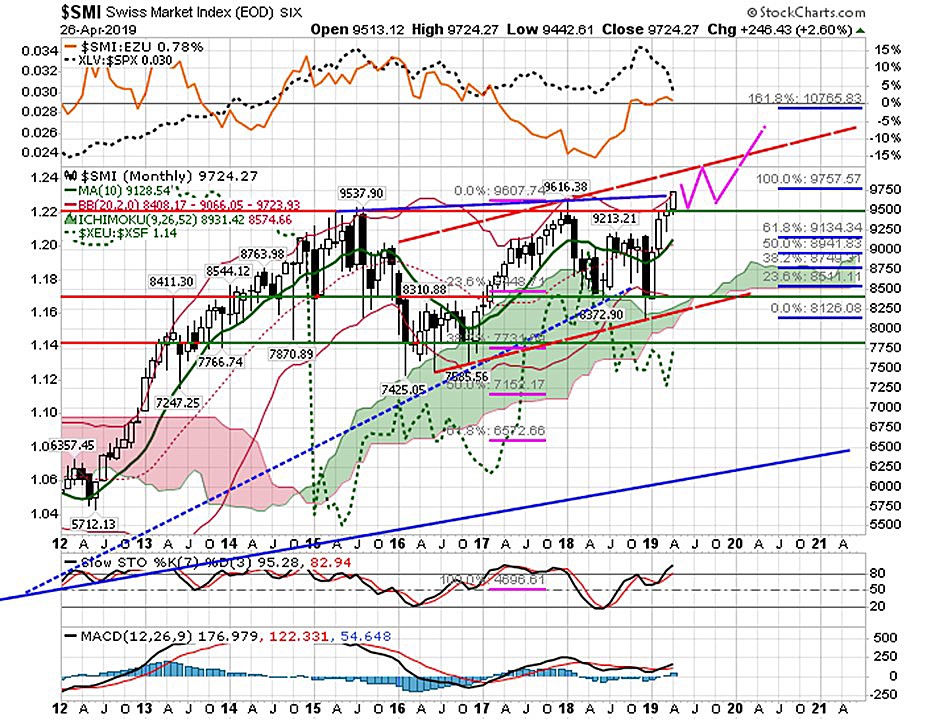
In the chart above we can see SMI in monthly candles with Ichimoku cloud and EURO-CHF currency represented in green dotted line behind the SMI candles (left scale). On the upper panel is displayed the rising Relative Strength (RS) of SMI versus ETF EZU (Europe , ex UK, ex CH) in orange solid line, which rose during the volatile part of 2018, displaying the “defensive” character of the SMI versus the EZU. It then flattened during the first quarter of 2019. Note the correlation of the Relative Strength of the US Pharmaceutical sector (XLV) versus S&P500 in black dotted line with the orange line at least in term of direction in the last 3 years, which also display the “defensive” nature of the Healthcare sector in the US. The SMI index is heavily weighted by Pharmaceutical / Healthcare sector and also of course by Banks. During the first quarter 2019, but the RS of SMI has paused, while the RS of XLV/ S&P500 has corrected down more sharply in the last weeks. As the SMI consolidates above 9600, both lines may resume their uptrends and help the SMI extend further upward toward resistance of wide rising channel near 10000 and higher along still rising STO & MACD, possibly as our violet path is suggesting by taking into account the traditional seasonality of the next 6 months .
Source of data: Stockcharts.com. Violet Paths is proposed by BEST.

Bruno Estier – SAMT Honorary Member – Former SAMT President 1995-2008. – bruno.estier@bluewin.ch
Disclaimer: the above article is for general information and educational purposes only. It is not intended to be investment advice. Seek a duly licensed professional for investment advice.