

S&P 500: a short-term analysis
The S&P 500 experienced from last 2018 December low, one of the strongest momentum rallies of its history in terms of price and time. Last Monday the index formed a high at 2.816,88 level and now the price returned below its 200-day moving average.
The oscillators, at the beginning of the week, were already showing signs that the market was forming a short-term top, but it is still too early to understand if prices will continue to fall or the last green candle of the weekend may be the beginning of a first short term recovery: currently the MACD has down crossed the signal line and RSI has slightly down crossed the level of 50; the VIX began to rise touching a level from which it moved away on Friday, by failing to confirm a new signal regarding the potential development of volatility.
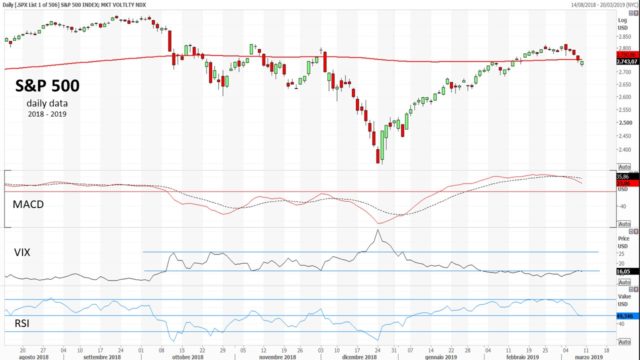
After the strong rally, indicators on weekly charts are slowing down, and on the monthly charts they are still pointing south.
The price patterns that we may encounter in this period are all characterized by the great uncertainty present in the economic and financial markets. This leads to short trends of violent and emotional nature where the prevalence between sellers and buyers alternates generating patterns like broadening formations or head-and-shoulders patterns.
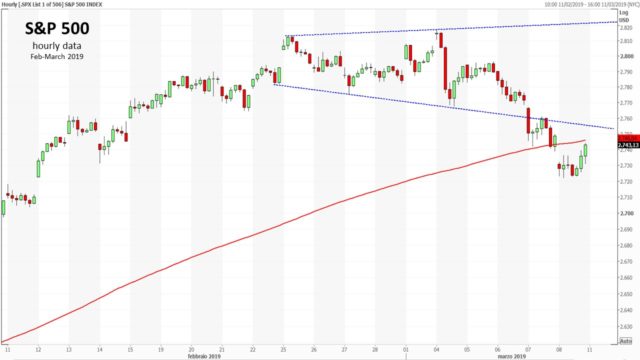
On the hourly chart we can notice a failed broadening formation whose down trendline together with 200-day moving average now form a resistance for the price.
If we look at a daily chart along with the relative strength ratio of the S&P 500 vs. the MSCI WORLD Index, we could note an earlier signal that is rather clear: a divergence between the Index and the ratio, which could indicate a continuation of the index’s weakness in comparison with the rest of the world (d).
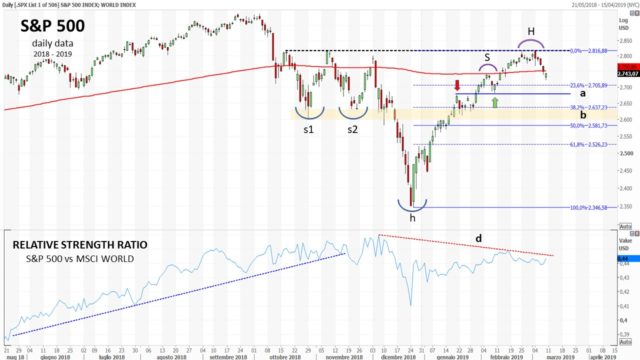
If prices continue to fall, I suggest you look at two particularly interesting price level areas. The first is around 2,670/2,680 (a). It corresponds to the potential neckline of a head-and-shoulders pattern, where the current head (H), may be in formation between 23.6% and 38.2% Fibonacci levels. The second area is around 50% of the Fibonacci level (b). If prices are supported in that area, a right shoulder of a complex inverse head-and-shoulders pattern (s1+s2+h) could be confirmed.

Mario Valentino GUFFANTI CFTe – SAMT Vice President – Swiss Italian Chapter – mario.guffanti@samt-org.ch
Disclaimer: the above article is for general information and educational purposes only. It is not intended to be investment advice. Seek a duly licensed professional for investment advice.