

S&P 500: in search for the Xmas rally
If we consider the Four-Year U.S. Presidential Cycle model, this year-end should be bullish for the S&P 500 index: statistically speaking, the last quarter of the second year of the mid-term elections and the next two quarters of the third year are generally favourable to the stock market. Moreover, the end of the year is commonly benign for the financial markets. But what is happening in recent weeks is putting a strain on the optimistic beliefs of market players, who are beginning to consider the arrival of a Christmas rally with increasingly lower probabilities.

If we look to the daily price chart of the S&P 500 index, we could note that since December 6th, prices have always been below the 20, 50 and 200 days moving averages, and we had also a bearish crossover between the 50-day and the 200-day moving averages: this are not good signs for the market.
If we connect the last two lower highs (h1 and h2) and the last two lower lows (l1 and l2), we can see that prices are within a channel with a negative inclination. The last candle touching the channel in l2 point, has a very long lower shadow, signalling that buyers have begun to reappear on the market and prices are taking some strength. Another indication of this kind is given by the oscillator, which in the same period in which the channel was formed has created a positive divergence (1).
The last four days, however, indicate weakness and laterality, and the VIX index is still too high to give any confirmation of the stability of the channel support (2): we must wait for the next periods to assess whether the albeit weak and brief bullish construction will be able to continue its path.
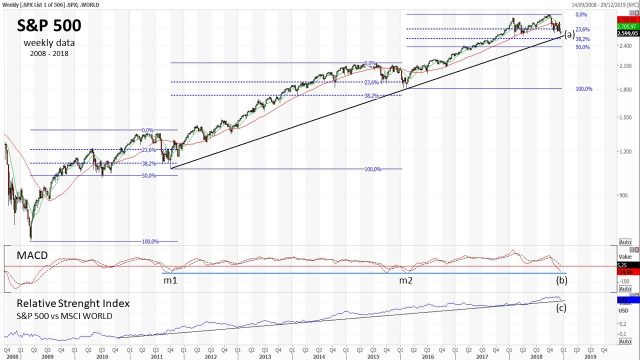
Looking to the Index since the 2009 bottom in a weekly graph, we can note that we have three impulsive waves with three retracements. If we measure the retracements starting from the most important low for every impulsive wave (the 2009 bottom and the two lows that corresponds to the lower measure of the MACD oscillator, m1 and m2), we can note that the first retracement arrived between 38,2% and 50% Fibonacci levels, the second between the 23,6% and 38,2% levels, and in this actual third retracement the price is again between 23,6% and 38,2% levels. Price is very near to the medium term up-trend line touched in the two previous corrections (a). The oscillator is approaching the static support line already touched by the two minimums of the previous corrections (b), and the relative strength index of the S&P 500 vs the MSCI World index, is going to retest the medium-term bullish trendline (c): these are all elements that indicate that the price could begin to consolidate.

Another help can be provided by the monthly S&P 500 graph together with the Bollinger bands, useful indicator to understand where the price could lead in terms of volatility. The lower Bollinger band coincides with the 50% Fibonacci retracement (1), that we have already observed in the previous chart. The range between the Friday close (2.599,95) and the level around 2.370, could then be considered an area where the price could form a short term important low for the next period.

Mario Valentino GUFFANTI CFTe – SAMT Vice President – Swiss Italian Chapter – mario.guffanti@samt-org.ch
Disclaimer: the above article is for general information and educational purposes only. It is not intended to be investment advice. Seek a duly licensed professional for investment advice.