

Stoxx 600: from short term patterns to long term considerations
At the beginning of April, I wrote about short term patterns on the S&P 500 Index and the Stoxx 600 Index.
With regard to the stoxx 600 index, I had pointed out that on short term basis, it was building a constructive situation. We had a divergence with the oscillator and the price was forming a falling wedge, that generally is a reversal pattern. But the relative strength ratio vs. the MSCI World Index, even if rising, had not yet reached the down trend line, and therefore the scenario could be still be premature.
Looking to the updated graph, we can see some encouraging signs, but there are still several confirmations to have a situation that has a probabilistic development favourable to a recovery of the bullish trend. From one side, the leading pattern of the divergence with the oscillator (1), anticipated the price break out of the falling wedge reversal pattern (2), but prices are confined to the level of a higher low, which is also the initial top point of the wedge. If they do not exceed this level in the next sessions, there is a risk of a double top that is bearish for the next 5-10 sessions.
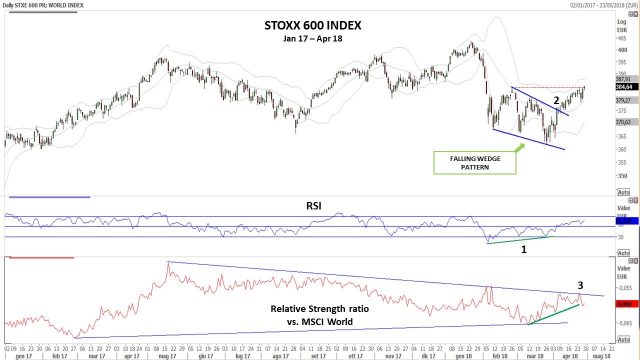
The relative strength ratio vs. the MSCI World Index does not give any encouraging signals for the moment: after having touched the resistance of the down trend line (3), the ratio has reversed and therefore the next sessions will be quite important to understand if the ratio could regain its relative strength.
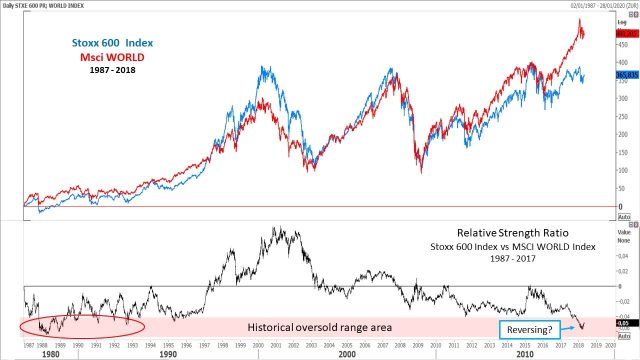
Historically speaking, in terms of relative strength versus the Msci World Index, the Stoxx 600 Index is falled at secular very low value. That could be considered also a kind of oversold zone where some kind of reaction could start.
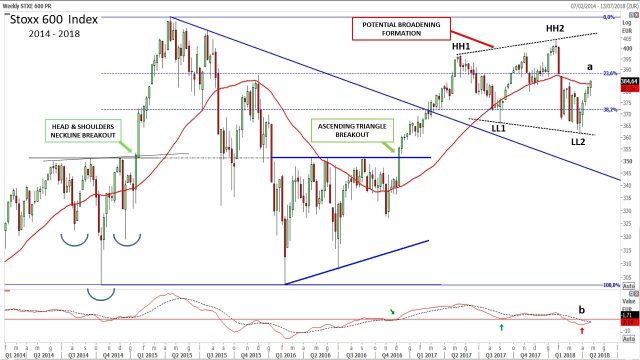
Looking to a medium term graph, we could see price that are forming a potential “orthodox broadening formation”. Broadening formations occur when a series of three or more price fluctuations widen out of size so that peaks and troughs can be connected with two diverging trendlines. The whole concept of widening price swings suggests highly emotional activity. Orthodox broadening formations are associated with market peaks, but in the last two years I noted that the same pattern on DJ Index and Russell 2000 Index have been negated, favouring the rising trend of the market.
The weekly candle close over the 200 day moving average and the MACD oscillator reverted (b). But the price must go further 23,6 Fibonacci level (a).
An interesting evidence that the Index needs to regain strength is that a part of its Supersector components are returned over their 200 days moving average prices, but not so much. You can see in the next graph a diffusion indicator, that calculates this condition and when exceeds the level of 12, together with the Macd cross over of the zero line (see in the graph the green vertical lines), we have a signal that generally anticipates a new uptrend: an exception occurred in 2012, where we had to wait a new signal, always in the same year, to have a real confirmation of the uptrend. At the moment we have the weakest situation from this strategy: Macd went again below zero (but it is reverting), and the indicator is gaining strength, but is still below 12.

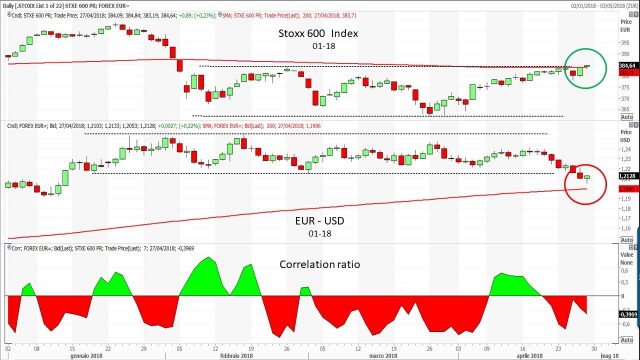
A last observation, could be done considering the historical negative correlation between the Stoxx 600 Index and the USD. Looking from the beginning of the year, both the price series, after a trading range period, are at the 200 day moving average level.

Mario Valentino GUFFANTI CFTe – SAMT Vice President – Swiss Italian Chapter – mario.guffanti@samt-org.ch
Disclaimer: the above article is for general information and educational purposes only. It is not intended to be investment advice. Seek a duly licensed professional for investment advice.