

The search for the dominant trend. A simple filter-strategy

A good method by which a trend can be determined, are moving averages. Once the parent tendency is determined, the main aim is to find a good Entry. This article shows such a method.
Indicators used
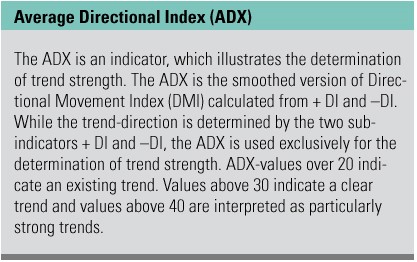
To determine the parent trend direction we use moving averages (Exponential Moving Averages, short EMAs). In practice, often are periods of 100 or 200 used. We use the EMA (200), as it reflects a larger and more reliable overall picture than the EMA (100). Once the course crosses upwards or downwards the EMA (200), we should as soon as possible switch sides in order to be in the new movement. In addition to the EMA (200), we are using other indicators: the EMA (20), the EMA (50) and the Average Directional Index (ADX) * with 14 periods. A trend is particularly strong when the ADX (14) is over 30. The ADX goes back to the Directional-Movement-Concept of Welles Wilder and is the smoothed version of Directional Movement Index calculated from the partial indicators + DI and –DI. + DI and -DI determine the trend direction, the ADX the trend strength (see box). We assume a dominant bullish tendency, as long as the price is above the EMA (200). On the other hand, we assume a dominant bearish tendency as long as the price is below the EMA (200). The opening of a long position must follow when the EMA (20) is above the EMA (50) while by ADX (14) the + DI is above the -DI. At a short-position, the EMA (20) tends below the EMA (50), while by ADX (14) the -DI is above the + DI.
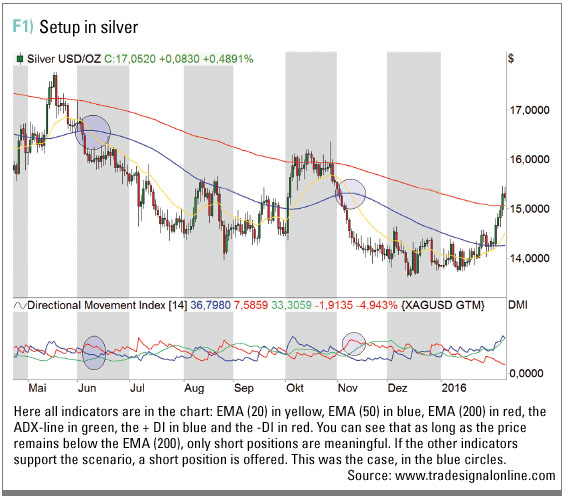
Figure 1 shows the indicators in the chart, so the strategy is complete: (EMA (20) in yellow, EMA (50) in blue, EMA (200) in red, the ADX line in green with the + DI in blue and the -DI in red). This is a daily chart of silver. You can see that as long as the price remains below the EMA (200), only short positions are meaningful. We do not want just to go short on that basis, but only if also the other indicators support the scenario. This was the case, in the blue circles.
Sideways markets
This strategy is particularly suitable to avoid the sideways markets. In such movements, the market is almost flat or changeable which makes it difficult to make money. This is exactly the time when targets are not reached and stops are often triggered, because in the most cases the price movement is short-term and erratic. For those who follow the trend or look for strong movements, sideways-phases lead to losses one after another. A certain way to cope with a sideways-market is to stay out – and exactly here is where our strategy can be helpful. Take a look at Figure 2.

The red, vertical lines encompass a sideways-trend in the daily chart of the USD / JPY. The ADX line (green in the sub-chart) is usually below 30, which means that there is no momentum in the market. It would be in our best interest to stay away from this market. Moreover, the constant crossings of the 20s and 50s EMAs show a mixed picture.
Trading examples
In Figure 3 we see clear, in the daily chart of the USD / CAD, bullish signals, which have met in each of the cases our Entry-criteria: Course over 200 EMA, 20 EMA above the 50 EMA; + DI above -DI. Following results were obtained:
Trade 1 = 290 pips
Trade 2 = 200 pips
Trade 3 = 1300 pips

By some currency pairs such as the GBP/NZD, GBP/AUD, EUR/NZD, GBP/CHF, EUR/AUD, NZD/JPY and AUD/JPY you can often see fast movements. However, make sure that you choose an appropriate position-size. If you are in a strong movement, a trailing stop is recommended. Although this sometimes has its negative sides, we are thus in a position to wait for more signals, while open profitable trades are hedged.
Conclusion
In a trend-less market, it is often difficult to generate profits. The discussed approach can help to avoid sideways-phases with erratic movements and to trade only then when a clear overriding tendency is present.


Feature article by:
![]()